Dreifache Bestätigung der Trendfolgestrategie durch Momentum-Indikator
Überblick
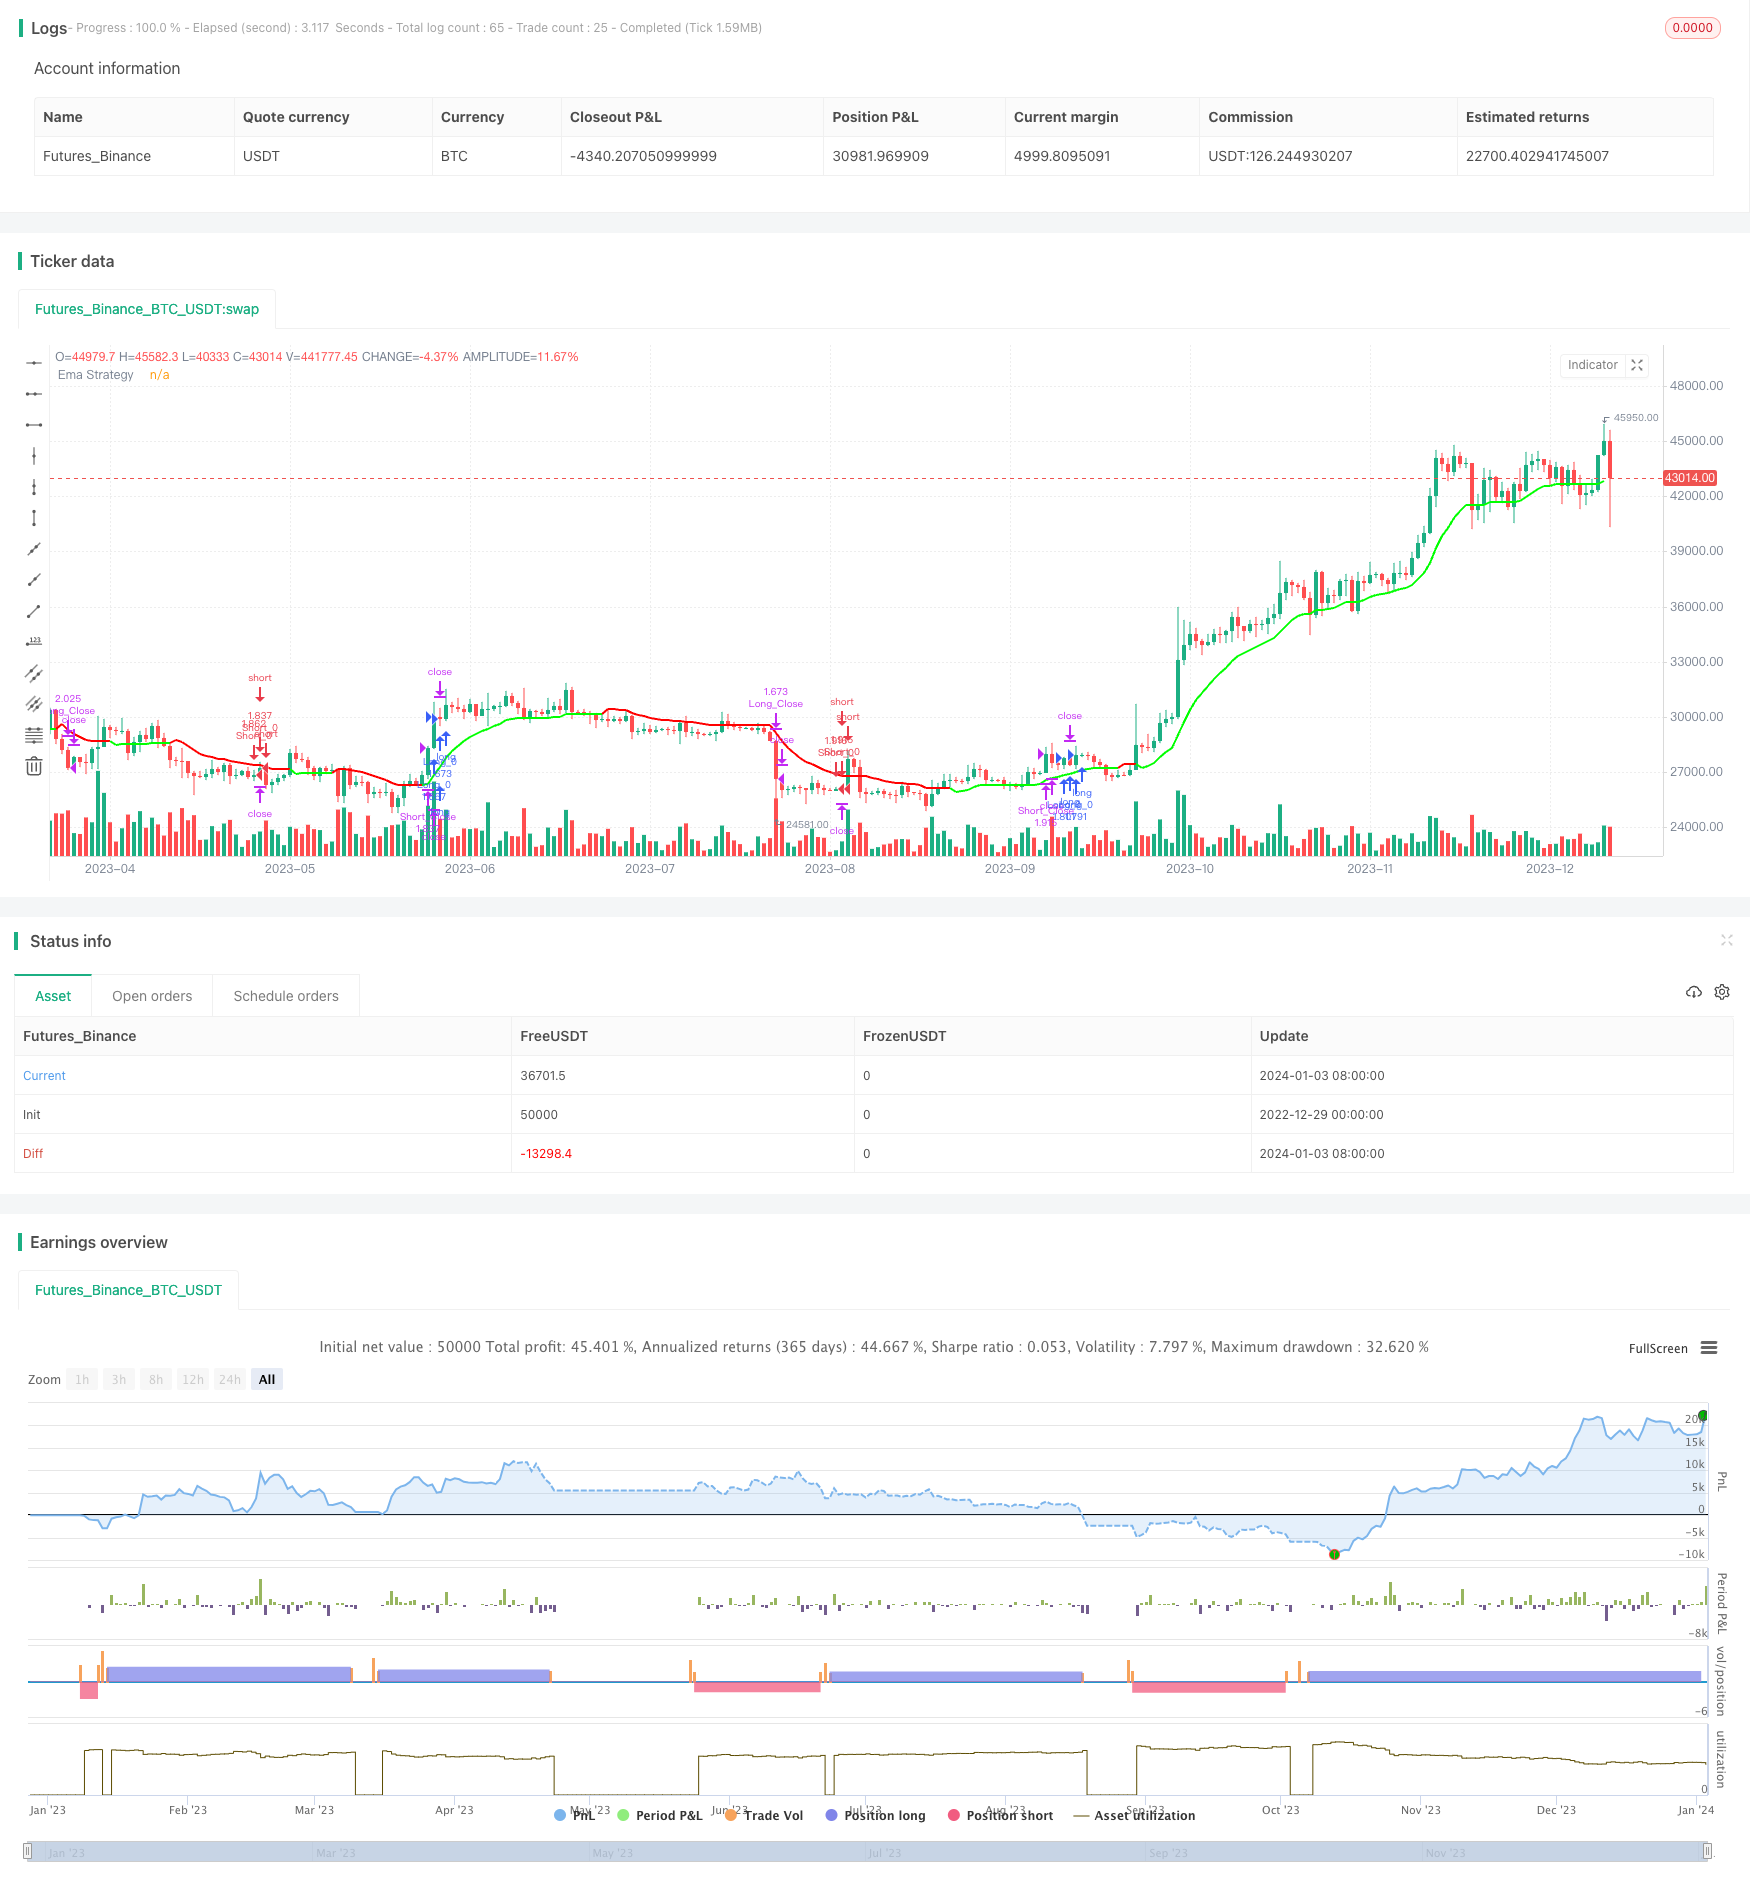
Die Strategie verwendet eine Dreifachbestätigungsmechanik, um Handelssignale zu erzeugen, d.h. ein dynamischer Indikator, der einen starken Markttrend bestätigt, ein Supertrend-Indikator, der die Richtung bestätigt, und ein EMA-Indikator als zusätzliche Bestätigung der Richtung. Die Strategie erzeugt nur dann ein Handelssignal für einen Über- oder Abnahmehandel, wenn alle drei Indikatoren die Voraussetzungen erfüllen, um sicherzustellen, dass nur Handelsmöglichkeiten mit hoher Wahrscheinlichkeit ausgewählt werden.
Strategieprinzip
Momentum RSI
Der Dynamik-RSI-Indikator wird verwendet, um die Stärke von Markttrends zu beurteilen. Wenn die Lesung größer als 60 ist, bedeutet dies, dass die Markttrends stark sind.
Die Handelssignale entstehen nur in heftigen Bullen- und Bärenmärkten.
Supertrend-Analyse
Die Supertrendlinie stellt die Richtung der Marktentwicklung dar. Es ist nur zu erwägen, eine Position zu eröffnen, wenn der Preis die Supertrendlinie überschreitet.
Wenn der Preis die Supertrendlinie von unten nach oben durchbricht, wird er in einen mehrköpfigen Trend umgewandelt; wenn der Preis von oben nach unten durchbricht, wird er in einen ungebundenen Trend umgewandelt.
Strategie der EMA
- Die EMA und ihre Hilfs-Trendlinie werden verwendet, um die Richtung der Tendenz zu bestätigen. Ein Kaufsignal wird nur angezeigt, wenn die EMA die Hilfs-Trendlinie nach oben durchbricht, während das Hohlkopfsignal umgekehrt ist.
Nur wenn diese drei Indikatoren gleichzeitig die Positionsbedingungen erfüllen, wird ein echtes Handelssignal ausgegeben. Dies reduziert die Anzahl der Falschsignale erheblich und erhöht die Stabilität der Strategie.
Analyse der Stärken
Die Strategie hat eine sehr hohe Stabilität und Gewinnwahrscheinlichkeit. Die Hauptvorteile sind:
Mehrfache Bestätigungsmechanismen, wirksame Noise-Filterung, nur für Transaktionen mit hoher Wahrscheinlichkeit.
Supertrendline-Dynamik zur Verfolgung von Stopps und zur effektiven Risikokontrolle.
In Kombination mit der Trendstärke kann man nur bei starken Trends handeln, um zusätzliche Risiken zu vermeiden.
Zusätzliche Verifizierung der EMA-Indikatoren stellt sicher, dass der Handel in die richtige Richtung geht.
Das System ist vollständig parametriert und kann von allen Händlern nach Bedarf angepasst werden.
Risikoanalyse
Die Hauptrisiken dieser Strategie bestehen aus falschen Handelssignalen, die durch Ausnahme-Breakthroughs verursacht werden. Die Hauptrisiken und Lösungen umfassen:
Gefahr eines falschen Durchbruchs: Erhöhung der Durchbruchsicherungsmechanismen.
Schwingungsrisiko erhöht: Stellschutzbereich entsprechend angepasst.
Trendwechselrisiken: Verkürzung der Haltungsdauer und zeitnahe Verluststopps.
Optimierungsrichtung
Die Strategie kann vor allem in folgenden Bereichen optimiert werden:
Optimierung der Parameter: Anpassung der Parameter für weitere Sorten.
Mehr Filter: Verbesserte Signalqualität in Verbindung mit mehr Messwerten.
Kombinierte Strategien: Kombinationen mit anderen Strategien, die sich gegenseitig ergänzen.
Dynamische Parameter: Parameter werden automatisch an die Marktumgebung angepasst.
Maschinelles Lernen: Automatische Suche nach optimalen Parametern mit Hilfe von Algorithmen.
Zusammenfassen
Die Strategie realisiert durch die effektive Kombination von Dynamikindikatoren, Supertrends und EMAs eine mehrfach bestätigte High-Probability-Trading-Strategie. Die strengen Durchbruch-Verifizierungsmechanismen machen sie auch äußerst stabil.
/*backtest
start: 2022-12-29 00:00:00
end: 2024-01-04 00:00:00
period: 1d
basePeriod: 1h
exchanges: [{"eid":"Futures_Binance","currency":"BTC_USDT"}]
*/

//@version=5
strategy('The Flash-Strategy (Momentum-RSI, EMA-crossover, ATR)', shorttitle='The Flash-Strategy (Momentum-RSI, EMA-crossover, ATR)', overlay=true,initial_capital = 1000)
//// author -  Baby_whale_to_moon

// MOM Rsi indicator
group_mom_rsi = "Rsi Of Momentum "
len = input.int(10, minval=1, title="Length Mom-Rsi", group =group_mom_rsi ,tooltip = 'This ind calculate Rsi value of Momentum we use this ind to determine power of trend')
src2 = close
mom = src2 - src2[len]
rsi_mom = ta.rsi(mom, len)
mom_rsi_val = input.int(60, minval=1, title="Mom-Rsi Limit Val", group =group_mom_rsi, tooltip = "When our Mom-Rsi value more then this we open LONG or Short, with help of this indicator we we determine the status of the trend")

// Super Trend Ind
group_supertrend = "SuperTrend indicator"
atrPeriod = input(10, "ATR Length SuperTrend", group = group_supertrend)
factor = input.float(3.0, "Factor SuperTrend", step = 0.01, group = group_supertrend)

[supertrend, direction] = ta.supertrend(factor, atrPeriod)

// Ema Indicator
group_most = "Ema indicator"
src = input(close, 'Source Ema Ind',group = group_most)
AP2 = input.int(defval=12, title='Length Ema Ind', minval=1,group = group_most)
Trail1 = ta.ema(src, AP2) //Ema func
AF2 = input.float(defval=1, title='Percent Ema Ind', minval=0.1,group = group_most) / 100
SL2 = Trail1 * AF2  // Stoploss Ema
Trail2 = 0.0
iff_1 = Trail1 > nz(Trail2[1], 0) ? Trail1 - SL2 : Trail1 + SL2
iff_2 = Trail1 < nz(Trail2[1], 0) and Trail1[1] < nz(Trail2[1], 0) ? math.min(nz(Trail2[1], 0), Trail1 + SL2) : iff_1
Trail2 := Trail1 > nz(Trail2[1], 0) and Trail1[1] > nz(Trail2[1], 0) ? math.max(nz(Trail2[1], 0), Trail1 - SL2) : iff_2

//Bull = ta.barssince(Trail1 > Trail2 and close > Trail2 and low > Trail2) < ta.barssince(Trail2 > Trail1 and close < Trail2 and high < Trail2)

//TS1 = plot(Trail1, 'ExMov', style=plot.style_line, color=Trail1 > Trail2 ? color.rgb(33, 149, 243, 100) : color.rgb(255, 235, 59, 100), linewidth=2)
//TS2 = plot(Trail2, 'ema', style=plot.style_line, color=Trail1 > Trail2 ? color.rgb(76, 175, 79, 30) : color.rgb(255, 82, 82, 30), linewidth=2)
//fill(TS1, TS2, Bull  ? color.green : color.red, transp=90)


// Strategy Sett
group_strategy = "Settings of Strategy"
Start_Time = input(defval=timestamp('01 January 2000 13:30 +0000'), title='Start Time of BackTest', group =group_strategy)
End_Time = input(defval=timestamp('30 April 2030 19:30 +0000'), title='End Time of BackTest', group =group_strategy)
dollar = input.float(title='Dollar Cost Per Position* ', defval=50000, group =group_strategy)
trade_direction = input.string(title='Trade_direction', group =group_strategy, options=['LONG', 'SHORT', 'BOTH'], defval='BOTH')
v1 = input(true, title="Version 1 - Uses SL/TP Dynamically ", group =group_strategy ,tooltip = 'With this settings our stoploss price increase or decrease with price to get better PNL score')

v2 = input(false, title="Version 2 -  Uses SL/TP Statically", group =group_strategy)
v2stoploss_input = input.float(5, title='Static Stop.Loss % Val', minval=0.01, group =group_strategy)/100
v2takeprofit_input = input.float(10, title='Static Take.Prof % Val', minval=0.01, group =group_strategy)/100

v2stoploss_level_long = strategy.position_avg_price * (1 - v2stoploss_input)
v2takeprofit_level_long = strategy.position_avg_price * (1 + v2takeprofit_input)

v2stoploss_level_short = strategy.position_avg_price * (1 + v2stoploss_input)
v2takeprofit_level_short = strategy.position_avg_price * (1 - v2takeprofit_input)

group_line = "Line Settings"
show_sl_tp = input.bool(title='  Show StopLoss - TakeProf Lines',inline = "1", defval=true, group =group_line)
show_trend_line = input.bool(title='  Show Trend Line',inline = '3' ,defval=true, group =group_line)
stoploss_colour = input.color(title='StopLoss Line Colour',inline = '2' ,defval=color.rgb(255, 255, 0), group =group_line)
up_trend_line_colour = input.color(title='Up Trend line Colour',inline = '4' ,defval=color.rgb(0, 255, 0, 30), group =group_line)
down_trend_line_colour = input.color(title='Down Trend line Colour',inline = '4' ,defval=color.rgb(255, 0, 0, 30), group =group_line)

//plot(supertrend ,color = strategy.position_size > 0 and show_sl_tp ? color.rgb(255, 0, 0) :show_sl_tp ? color.rgb(0, 255, 0) : na , style = plot.style_steplinebr,linewidth = 2)
// plot(supertrend ,color = show_sl_tp and v1 ? stoploss_colour : na , style = plot.style_steplinebr,linewidth = 2)

// plot(v2stoploss_level_long ,color = strategy.position_size > 0 and show_sl_tp and v2 ? stoploss_colour : na , style = plot.style_steplinebr,linewidth = 2)
// plot(v2stoploss_level_short ,color = strategy.position_size < 0 and show_sl_tp and v2 ? stoploss_colour : na , style = plot.style_steplinebr,linewidth = 2)
// plot(v2takeprofit_level_long  ,color = strategy.position_size > 0 and show_sl_tp and v2 ? up_trend_line_colour : na , style = plot.style_steplinebr,linewidth = 2)
// plot(v2takeprofit_level_short ,color = strategy.position_size < 0 and show_sl_tp and v2 ? up_trend_line_colour : na , style = plot.style_steplinebr,linewidth = 2)


TS2 = plot(Trail2, 'Ema Strategy', style=plot.style_line, color=show_trend_line and Trail1 < Trail2 ? down_trend_line_colour : show_trend_line ? up_trend_line_colour  : na, linewidth=2)

// bgcolor(buy_signal ? color.rgb(0, 230, 119, 80) : na)
// bgcolor(sell_signal ? color.rgb(255, 82, 82, 80) : na)

Time_interval = true
buy_signal = Trail1 > Trail2 and direction < 0 and rsi_mom > mom_rsi_val and Time_interval
sell_signal =Trail1 < Trail2 and direction > 0 and rsi_mom > mom_rsi_val and Time_interval


// Strategy entries
if strategy.opentrades == 0 and buy_signal and ( trade_direction == 'LONG' or trade_direction == 'BOTH')
    strategy.entry('Long_0', strategy.long, qty=dollar / close)

if strategy.opentrades == 0 and sell_signal and ( trade_direction == 'SHORT' or trade_direction == 'BOTH')
    strategy.entry('Short_0', strategy.short, qty=dollar / close)


if close < supertrend and v1
    strategy.exit('Long_Close',from_entry = "Long_0", stop=supertrend, qty_percent=100)
if  v2 and strategy.position_size > 0
    strategy.exit('Long_Close',from_entry = "Long_0", stop=v2stoploss_level_long,limit= v2takeprofit_level_long  , qty_percent=100)

if close > supertrend and v1
    strategy.exit('Short_Close',from_entry = "Short_0", stop=supertrend, qty_percent=100)
if  v2 and strategy.position_size < 0
    strategy.exit('Short_Close',from_entry = "Short_0", stop=v2stoploss_level_short,limit= v2takeprofit_level_short ,qty_percent=100)