
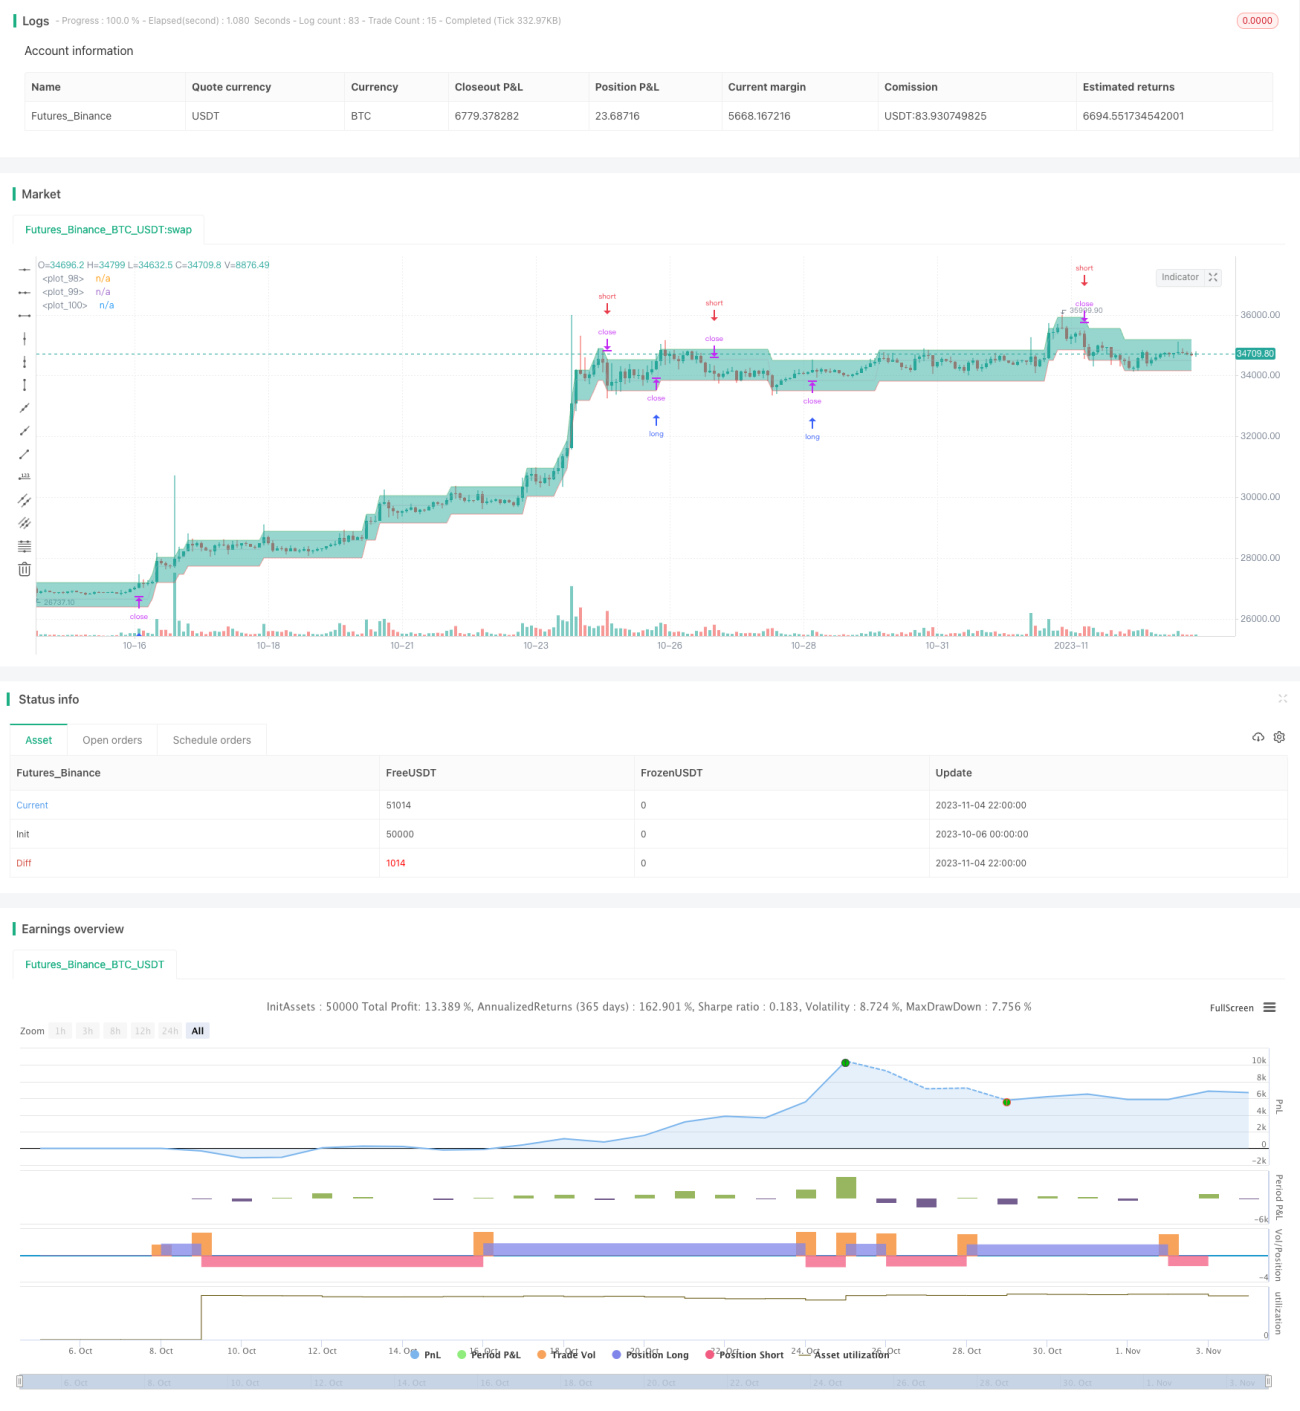
La estrategia de bloques de tendencia es una estrategia de negociación basada en el porcentaje de cambio de precio o el número de puntos de salto. Puede mostrar claramente las tendencias locales y los puntos de inflexión en el gráfico. Es una herramienta muy útil para seguir la dirección de los precios.
La estrategia se calcula basándose en el porcentaje de variación de los precios o en la desviación de los puntos de inflexión (expresada en el parámetro de desviación de la barra) y se muestra en el gráfico en forma de líneas diagonales.
Cada línea está compuesta por una línea media, superior y inferior de referencia:
La línea media de referencia es igual a la línea superior o inferior de la línea anterior o siguiente (si el precio cambia rápidamente en un intervalo de tiempo, la línea media de referencia de la línea actual será mayor que la línea superior de la línea anterior o menor que la línea inferior de la línea siguiente por un número equivalente de desviaciones, dependiendo de la dirección en que se mueva el precio). Al comienzo del cálculo, la línea media de referencia es igual al valor inicial de la primera línea.
El parámetro de la cantidad de columnas determina la cantidad de desviación de la línea superior o inferior en función de la dirección de la variación del precio, y el parámetro de la columna de giro determina la cantidad de desviación que cambia la dirección de la variación del precio.
Reglas para construir una nueva línea:
Si el precio de cierre es mayor que el límite superior y el precio de cierre es mayor que el precio de apertura, el límite superior se moverá gradualmente hacia arriba, y el límite inferior se moverá también, pero con menor amplitud.
Si el precio mínimo es ≤ el límite inferior y el precio de cierre es < el precio de apertura, el límite inferior se moverá gradualmente hacia abajo, y el límite superior también se moverá hacia abajo, pero con menor amplitud.
Al ajustar la diferencia, se pueden ver claramente las tendencias locales y los puntos de inflexión en el gráfico. Esta es una herramienta muy útil para seguir el movimiento de los precios.
La visualización muestra la tendencia de cambio de precios y identifica claramente la resistencia de soporte.
La diagonal muestra claramente la intensidad de la ruptura y el alcance de la regresión.
Se pueden identificar tendencias de diferentes intensidades según la inclinación de la línea angular que se necesite ajustar.
En la actualidad, la mayoría de los países de la región están en la fase de transición hacia el euro.
El cambio de ritmo de los precios es fácil de ver y así ajustar las posiciones.
La diagonal no puede predecir con exactitud el movimiento de los precios posteriores.
Hay que estar atento a los desvíos en la tendencia, que pueden ser diferentes de los precios reales.
No es una estrategia en solitario, sino que se debe combinar con otros indicadores para evaluar las grandes tendencias.
Hay que tener en cuenta que un ajuste incorrecto de los parámetros puede conducir a una transacción demasiado frecuente.
La posibilidad de que se necesite una reversión de alerta en el retorno, no puede ser rastreada a ciegas por la máquina.
Se puede reducir el tamaño de la posición de manera adecuada, y al mismo tiempo hacer referencia a otros indicadores como juicio auxiliar para operar bajo una gran tendencia.
Se puede agregar un módulo de administración de posiciones para ajustar dinámicamente las posiciones en diferentes etapas de la tendencia.
Se puede combinar con un indicador de volatilidad para reducir la posición cuando la volatilidad aumenta.
Se puede establecer un punto de parada para controlar las pérdidas individuales en función de la proporción de retirada.
Se puede añadir un filtro para suspender la negociación en caso de desviación.
Se puede dividir la inclinación diagonal en varios niveles para identificar cambios de tendencia de diferentes intensidades.
Se puede seguir la tendencia de los precios de manera más estable mediante el ajuste dinámico de las posiciones, la configuración de los paros y las condiciones de filtración.
La estrategia de bloques de tendencias utiliza la diagonal para mostrar de forma intuitiva los cambios en la tendencia de los precios, lo que permite identificar claramente los puntos de resistencia y los puntos de ruptura. Sin embargo, no se puede confiar en el juicio independiente de la diagonal, y se necesita un análisis integral complementado con otros indicadores, al tiempo que se controla el riesgo.
/*backtest
start: 2023-10-06 00:00:00
end: 2023-11-05 00:00:00
period: 2h
basePeriod: 15m
exchanges: [{"eid":"Futures_Binance","currency":"BTC_USDT"}]
*/
//@version=5
// **********************************************************************************
// This code is invented and written by @StCogitans.
// The idea presented in this code and the rights to this code belong to @StCogitans.
// © https://www.tradingview.com/u/StCogitans
//
// Description.
// Sizeblock - a price change strategy in the form of diagonal rows.
// **********************************************************************************
// STRATEGY
string NAME = 'Sizeblock'
string ACRONYM = 'SB'
bool OVERLAY = true
int PYRAMIDING = 0
string QTY_TYPE = strategy.percent_of_equity
float QTY_VALUE = 100
float CAPITAL = 100
string COM_TYPE = strategy.commission.percent
float COM_VALUE = 0.1
bool ON_CLOSE = false
bool BAR_MAGNIFIER = false
bool OHLC = true
strategy(NAME, ACRONYM, OVERLAY, pyramiding=PYRAMIDING, default_qty_type=QTY_TYPE, default_qty_value=QTY_VALUE, initial_capital=CAPITAL, commission_type=COM_TYPE, commission_value=COM_VALUE, process_orders_on_close=ON_CLOSE, use_bar_magnifier=BAR_MAGNIFIER, fill_orders_on_standard_ohlc=OHLC)
// ARGUMENTS
// Datetime
DTstart = input(timestamp("01 Jan 2000 00:00 +0000"), 'Start time', group='Datetime')
DTfinish = input(timestamp("01 Jan 2080 23:59 +0000"), 'Finish time', group='Datetime')
DTperiod = true
// Main
dev_source = input.string('Close', title='Source', options=["Close", "HighLow"], tooltip='Price data for settlement.', group='Main')
dev_type = input.string('Percentage', title='Deviation', options=['Percentage', 'Ticks'], tooltip='The type of deviation to calculate.', group='Main')
dev_value = input.float(1, title='Quantity', minval=0.001, step=0.01, tooltip='Quantity to be calculated.', group='Main')
dev_back = input.float(2, title='U-turn', minval=0.001, step=0.01, tooltip='Quantity for reversal.', group='Main')
mode = input.string('Limit', title='Positions', options=['Limit', 'Market'], tooltip='Limit or market orders.', group='Main')
direct = input.string('All', title='Direction', options=['All', 'Buy', 'Sell'], tooltip='The type of positions to be opened.', group='Main')
swapping = input.bool(false, title='Swapping', tooltip='Swap points to open a new position.', group='Main')
// CALCULATION SYSTEM
Assembling(s, t, v, vb) =>
float a = open
float b = close
float c = s == "HighLow" ? math.round_to_mintick(high) : math.round_to_mintick(b)
float d = s == "HighLow" ? math.round_to_mintick(low) : math.round_to_mintick(b)
float x = math.round_to_mintick(a)
x := nz(x[1], x)
float _v = t == "Ticks" ? syminfo.mintick * v : v
float _vb = t == "Ticks" ? syminfo.mintick * vb : vb
float h = t == "Ticks" ? math.round_to_mintick(x + _v) : math.round_to_mintick(x * (1 + _v / 100))
float l = t == "Ticks" ? math.round_to_mintick(x - _v) : math.round_to_mintick(x * (1 - _v / 100))
h := nz(h[1], h)
l := nz(l[1], l)
if t == "Ticks"
if c >= h and b > a
while c >= h
x := h
h := math.round_to_mintick(h + _v)
l := math.round_to_mintick(x - _vb)
if d <= l and b < a
while d <= l
x := l
l := math.round_to_mintick(l - _v)
h := math.round_to_mintick(x + _vb)
else if t == "Percentage"
if c >= h and b > a
while c >= h
x := h
h := math.round_to_mintick(h * (1 + _v / 100))
l := math.round_to_mintick(x * (1 - _vb / 100))
if d <= l and b < a
while d <= l
x := l
l := math.round_to_mintick(l * (1 - _v / 100))
h := math.round_to_mintick(x * (1 + _vb / 100))
[x, h, l]
[lx, lh, ll] = Assembling(dev_source, dev_type, dev_value, dev_back)
// PLOT
// Lines
plot_up = plot(lh, color=color.new(color.green, 50), style=plot.style_line, linewidth=1)
plot_main = plot(lx, color=color.new(color.silver, 50), style=plot.style_line, linewidth=1)
plot_down = plot(ll, color=color.new(color.red, 50), style=plot.style_line, linewidth=1)
// Areas
fill(plot_up, plot_main, lh, lx, color.new(color.teal, 80), color.new(color.teal, 80))
fill(plot_main, plot_down, lx, ll, color.new(color.maroon, 80), color.new(color.maroon, 80))
// TRADING
// Alert variables
int Action = -1
int PosType = -1
int OrderType = -1
float Price = -1.0
// Direction variables
bool ifBuy = direct == "All" or direct == "Buy" ? true : false
bool ifSell = direct == "All" or direct == "Sell" ? true : false
// Market entries
if (strategy.closedtrades + strategy.opentrades == 0 or mode == "Market") and DTperiod
if ((swapping and lx < nz(lx[1], lx)) or (not swapping and lx > nz(lx[1], lx))) and ifBuy
Action := 1
PosType := 1
OrderType := 1
Price := math.round_to_mintick(close)
strategy.entry('Long', strategy.long)
if ((swapping and lx > nz(lx[1], lx)) or (not swapping and lx < nz(lx[1], lx))) and ifSell
Action := 2
PosType := 2
OrderType := 1
Price := math.round_to_mintick(close)
strategy.entry('Short', strategy.short)
// Closing positions by market
if DTperiod and mode == "Market"
if direct == "Buy" and strategy.position_size > 0
if swapping and lx > nz(lx[1], lx)
Action := 2
PosType := 3
OrderType := 1
Price := math.round_to_mintick(close)
strategy.close('Long', comment='Close')
if not swapping and lx < nz(lx[1], lx)
Action := 2
PosType := 3
OrderType := 1
Price := math.round_to_mintick(close)
strategy.close('Long', comment='Close')
if direct == "Sell" and strategy.position_size < 0
if swapping and lx < nz(lx[1], lx)
Action := 1
PosType := 3
OrderType := 1
Price := math.round_to_mintick(close)
strategy.close('Short', comment='Close')
if not swapping and lx > nz(lx[1], lx)
Action := 1
PosType := 3
OrderType := 1
Price := math.round_to_mintick(close)
strategy.close('Short', comment='Close')
// Limit entries and exits
if swapping and DTperiod and mode == "Limit"
if strategy.position_size < 0
Action := 1
PosType := 1
OrderType := 2
Price := ll
if ifBuy
strategy.entry('Long', strategy.long, limit=ll)
else
PosType := 3
strategy.exit('Exit', limit=ll)
if strategy.position_size > 0
Action := 2
PosType := 2
OrderType := 2
Price := lh
if ifSell
strategy.entry('Short', strategy.short, limit=lh)
else
PosType := 3
strategy.exit('Exit', limit=lh)
if strategy.closedtrades + strategy.opentrades > 0 and strategy.position_size == 0
if ifBuy
Action := 1
PosType := 1
OrderType := 2
Price := ll
strategy.entry('Long', strategy.long, limit=ll)
if ifSell
Action := 2
PosType := 2
OrderType := 2
Price := lh
strategy.entry('Short', strategy.short, limit=lh)
if not swapping and DTperiod and mode == "Limit"
if strategy.position_size < 0
Action := 1
PosType := 1
OrderType := 2
Price := lh
if ifBuy
strategy.entry('Long', strategy.long, stop=lh)
else
PosType := 3
strategy.exit('Exit', stop=lh)
if strategy.position_size > 0
Action := 2
PosType := 2
OrderType := 2
Price := ll
if ifSell
strategy.entry('Short', strategy.short, stop=ll)
else
PosType := 3
strategy.exit('Exit', stop=ll)
if strategy.closedtrades + strategy.opentrades > 0 and strategy.position_size == 0
if ifBuy
Action := 1
PosType := 1
OrderType := 2
Price := lh
strategy.entry('Long', strategy.long, stop=lh)
if ifSell
Action := 2
PosType := 2
OrderType := 2
Price := ll
strategy.entry('Short', strategy.short, stop=ll)
// Everything is closed and canceled
if not DTperiod
strategy.cancel_all()
strategy.close_all(comment='Close')
// Alerts
// Convert to string variables
string Action_Txt = Action == 1 ? "Buy" : Action == 2 ? "Sell" : na
string PosType_Txt = PosType == 1 ? "Long" : PosType == 2 ? "Short" : PosType == 3 ? "Flat" : na
string OrderType_Txt = OrderType == 1 ? "Market" : OrderType == 2 ? "Limit" : na
string Price_Txt = Price > 0 ? str.tostring(Price) : na
// Output
if not (Action == nz(Action[1], Action) and Price == nz(Price[1], Price) and OrderType == nz(OrderType[1], OrderType)) and DTperiod
alert('{"pair": "' + syminfo.ticker + '", "direction": "' + Action_Txt + '", "entertype": "' + OrderType_Txt + '", "position": "' + PosType_Txt + '", "price": "' + Price_Txt + '"}')
// *********************
// Good job, Soldier! ;>
// *********************