Estrategia de trading cuantitativo con RSI doble

Descripción general
La estrategia utiliza el indicador RSI doble para el comercio a corto y largo plazo en ambos sentidos, y se combina con el sistema de línea de equilibrio para determinar la dirección de la tendencia, pertenece a la estrategia de cuantificación de doble RSI. La estrategia utiliza primero el indicador RSI para determinar la señal de la carencia de más, y luego combina la línea de equilibrio para determinar la dirección de la tendencia para decidir hacer más carencia, pertenece a la estrategia de seguimiento de tendencia típica.
Análisis de principios
La estrategia de cuantificación de doble RSI utiliza principalmente el indicador RSI de doble período de tiempo para determinar la señal de negociación. La estrategia primero establece dos parámetros RSI, un período más largo como juicio de negociación principal y un período más corto como filtro auxiliar. Cuando el RSI de período más largo rompe la línea de venta, se produce una señal de multiplicación.
Para filtrar las señales falsas, la estrategia también introduce las medias SMA y EMA para determinar la tendencia. Sólo se considera el RSI para hacer más señales cuando las líneas SMA cortas atraviesan las líneas EMA largas, y solo se considera el RSI para hacer señales de vacío cuando las líneas SMA cortas atraviesan las líneas EMA largas.
Además, la estrategia también establece una lógica de stop loss. Una vez abierta la posición, se toman dos diferentes cantidades de órdenes de stop loss al mismo tiempo y se establece un stop loss.
Análisis de las ventajas
La estrategia de cuantificación de doble RSI tiene las siguientes ventajas:
-
El indicador de RSI de doble período de tiempo puede determinar con mayor precisión la señal de espacio abundante. La combinación cruzada de RSI de período largo y corto puede filtrar algunas señales falsas y mejorar la calidad de la señal.
-
El sistema de líneas medias ayuda a determinar la dirección de la tendencia general, evita hacer operaciones contra la tendencia y puede filtrar la mayor parte de las operaciones de ruido y mejorar la tasa de ganancias.
-
Un mecanismo de stop-loss flexible, que permite obtener mayores ganancias a través de diferentes configuraciones de stop-loss, y también puede detener el riesgo para controlar el riesgo.
-
La lógica de las estrategias de negociación es simple y clara, fácil de entender y optimizar, adecuada para el aprendizaje de los operadores cuantitativos.
Análisis de riesgos
A pesar de las ventajas de la estrategia de cuantificación de dos RSI, también existen los siguientes riesgos:
-
El indicador RSI por sí solo no tiene efecto en el juicio de la oscilación y la reversión de la tendencia, y la estrategia puede ser ineficaz para el comercio en estos mercados.
-
Aunque el sistema de línea media puede filtrar el ruido de un rango pequeño, no es muy eficaz para juzgar los cambios de tendencia en el ciclo intermedio y puede perder el punto de inflexión de la tendencia.
-
La configuración incorrecta de la parada de pérdidas puede causar que la parada de pérdidas sea demasiado amplia o demasiado pequeña, lo que reduce la eficacia de la estrategia.
-
El exceso de descubiertos masivos puede causar pérdidas masivas, por lo que es necesario controlar el tamaño de las posiciones.
Para los riesgos anteriores, se puede reducir el riesgo mediante la adaptación de los parámetros RSI, la introducción de indicadores de tendencia y reversión más avanzados, la optimización de la lógica de stop loss y el control de las posiciones.
Dirección de optimización
Las estrategias de cuantificación del doble RSI pueden optimizarse aún más en las siguientes direcciones:
-
Prueba diferentes combinaciones de parámetros, optimiza los parámetros del ciclo RSI y encuentra la mejor combinación de indicadores RSI de largo y corto período.
-
Prueba diferentes indicadores de medias, introduce indicadores como el MACD para determinar tendencias y oportunidades de reversión.
-
Optimice las estrategias de stop loss, configure un stop loss de seguimiento o un stop loss móvil para que el stop loss sea más flexible.
-
Aumentar el módulo de control de posiciones, control de más posiciones de descubierto en las diferentes fases de la tendencia de grandes ciclos.
-
El aumento de los modelos de aprendizaje automático mejora la precisión de las entradas y salidas.
-
Para realizar la optimización de la retrospectiva, encontrar la mejor variedad de transacciones y el período de tiempo.
Resumir
La estrategia de cuantificación de doble RSI es una estrategia típica de seguimiento de tendencias en general. La combinación de los indicadores de doble RSI para juzgar las señales de negociación y la estrategia de filtrado de ruido del sistema lineal es muy clásica y práctica. Aunque la estrategia también tiene cierto espacio para mejorar, la lógica de funcionamiento general es clara, fácil de entender y optimizar.
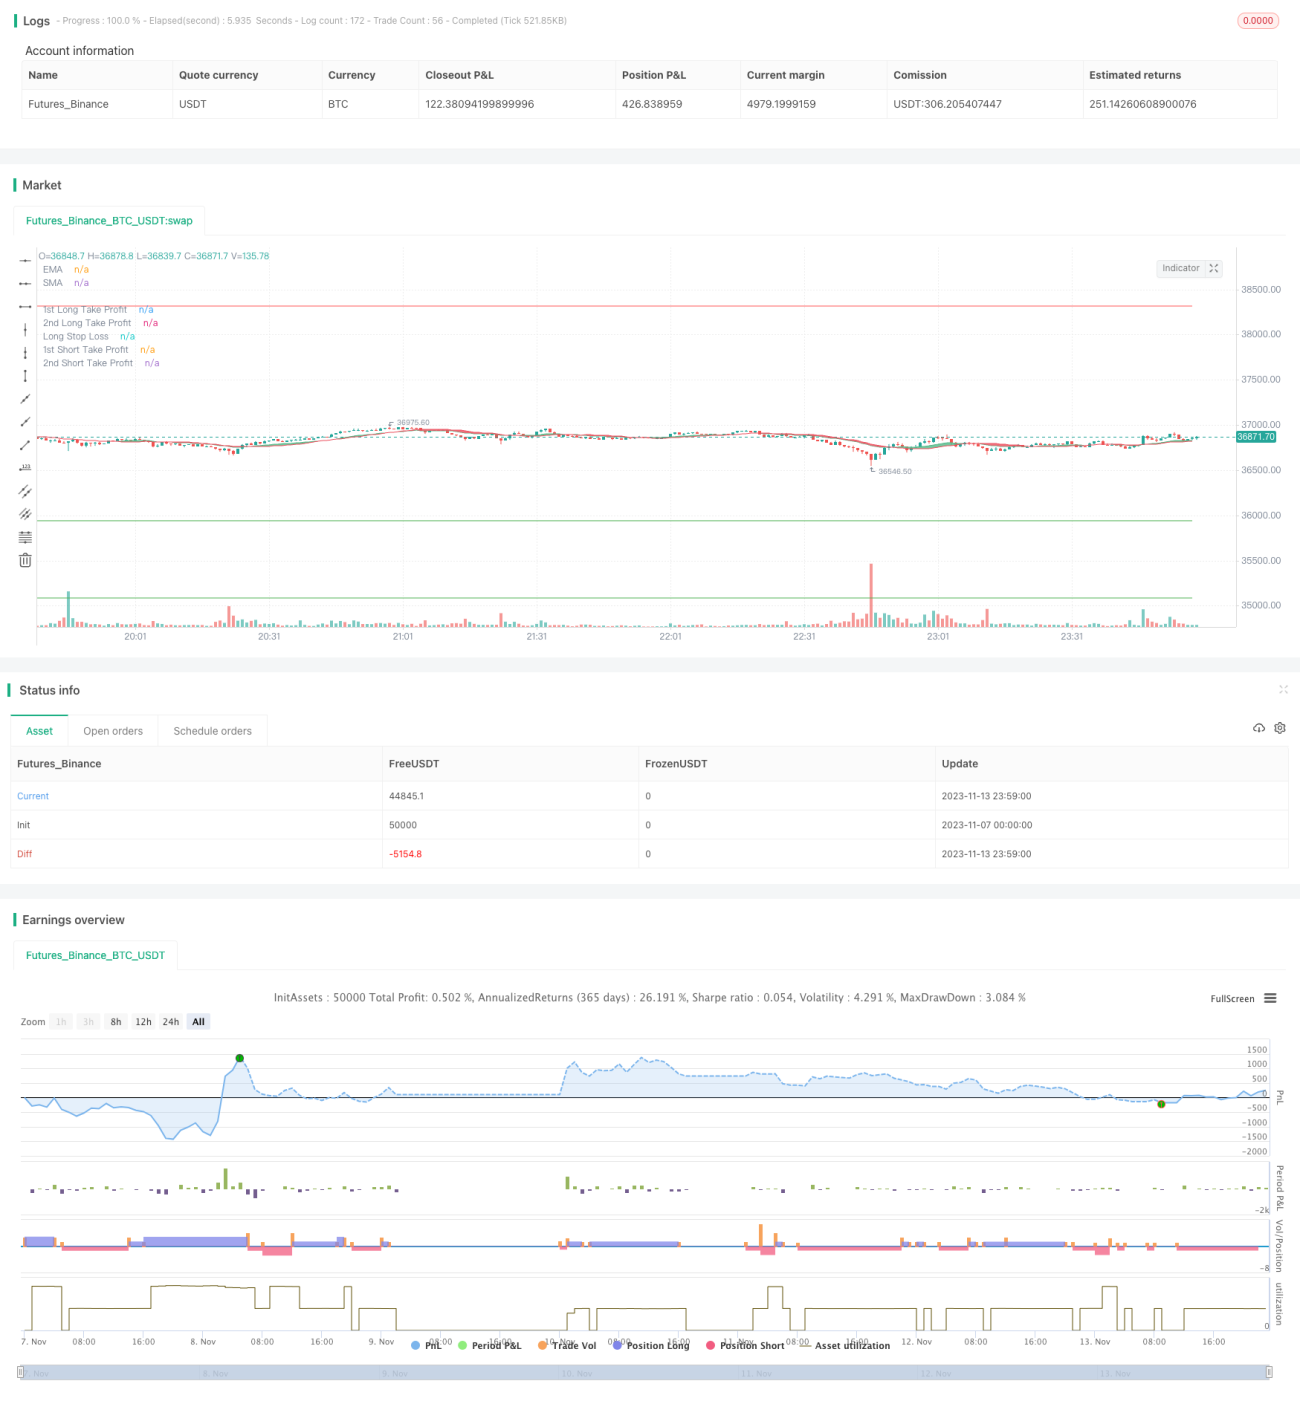
/*backtest
start: 2023-11-07 00:00:00
end: 2023-11-14 00:00:00
period: 1m
basePeriod: 1m
exchanges: [{"eid":"Futures_Binance","currency":"BTC_USDT"}]
*/

//@version=4
strategy("Growth Producer", overlay=true, initial_capital = 1000, currency = "USD", pyramiding = 2, commission_type=strategy.commission.percent, commission_value=0.07, default_qty_type = strategy.percent_of_equity, default_qty_value = 100)

//Functions- 1