Estrategia de puntos clave para el trading intradiario


Fecha de creación: 2023-12-07 16:43:17 Última modificación: 2023-12-07 16:43:17
Copiar: 0 Número de Visitas: 707
1
Seguir
1619
Seguidores

Estrategia de puntos clave para el trading intradiario

Descripción general

Se trata de una estrategia de puntos clave para el comercio intradiario en la India, que utiliza el precio de apertura, el precio más alto, el precio más bajo y el precio de cierre para calcular los puntos clave de soporte y resistencia y negociar cuando se producen rupturas de precios en estos puntos.

Principio de estrategia

  1. Cálculo de los precios máximos, mínimos y finales del día anterior
  2. Calcular el punto de soporte principal S1, el punto de resistencia R1 y el punto crítico PP de acuerdo con la fórmula
  3. Las posiciones de venta o ventaja se inician cuando el precio supera estos puntos clave.
  4. Configuración de un mecanismo de salida de pérdidas

Las principales fórmulas para calcular puntos clave son las siguientes:

PP = (最高价+最低价+收盘价)/3
R1 = 2*PP - 最低价  
S1 = 2*PP - 最高价

Análisis de las ventajas

  1. Utilice puntos clave para ofrecer brechas de alta probabilidad y aumentar las oportunidades de ganancias
  2. Los puntos clave son fáciles de identificar y las reglas de negociación son claras.
  3. Los puntos de parada son fáciles de configurar y controlan el riesgo de manera efectiva

Análisis de riesgos

  1. Puntos críticos donde se podría producir un falso avance y causar pérdidas
  2. La validez de los puntos clave requiere verificación, y no siempre es válida.
  3. La configuración incorrecta de los puntos de parada puede aumentar las pérdidas

La solución al riesgo:

  1. combining with other indicators to filter false breakouts
  2. backtesting to validate strategy over long timeframes
  3. optimize stop loss placement

Dirección de optimización

  1. En combinación con otros indicadores técnicos, filtra las señales de brecha falsas
  2. Optimización de parámetros para diferentes variedades
  3. Punto de parada de ajuste dinámico

Resumir

La estrategia en general es simple, directa y fácil de verificar a través de datos históricos. Como estrategia de day trading, utiliza los puntos clave para proporcionar brechas de alta probabilidad y puede obtener buenos resultados. Pero debido a la dependencia de los puntos clave, también existe un cierto riesgo de falsa brecha, que necesita ser optimizado aún más para reducir.
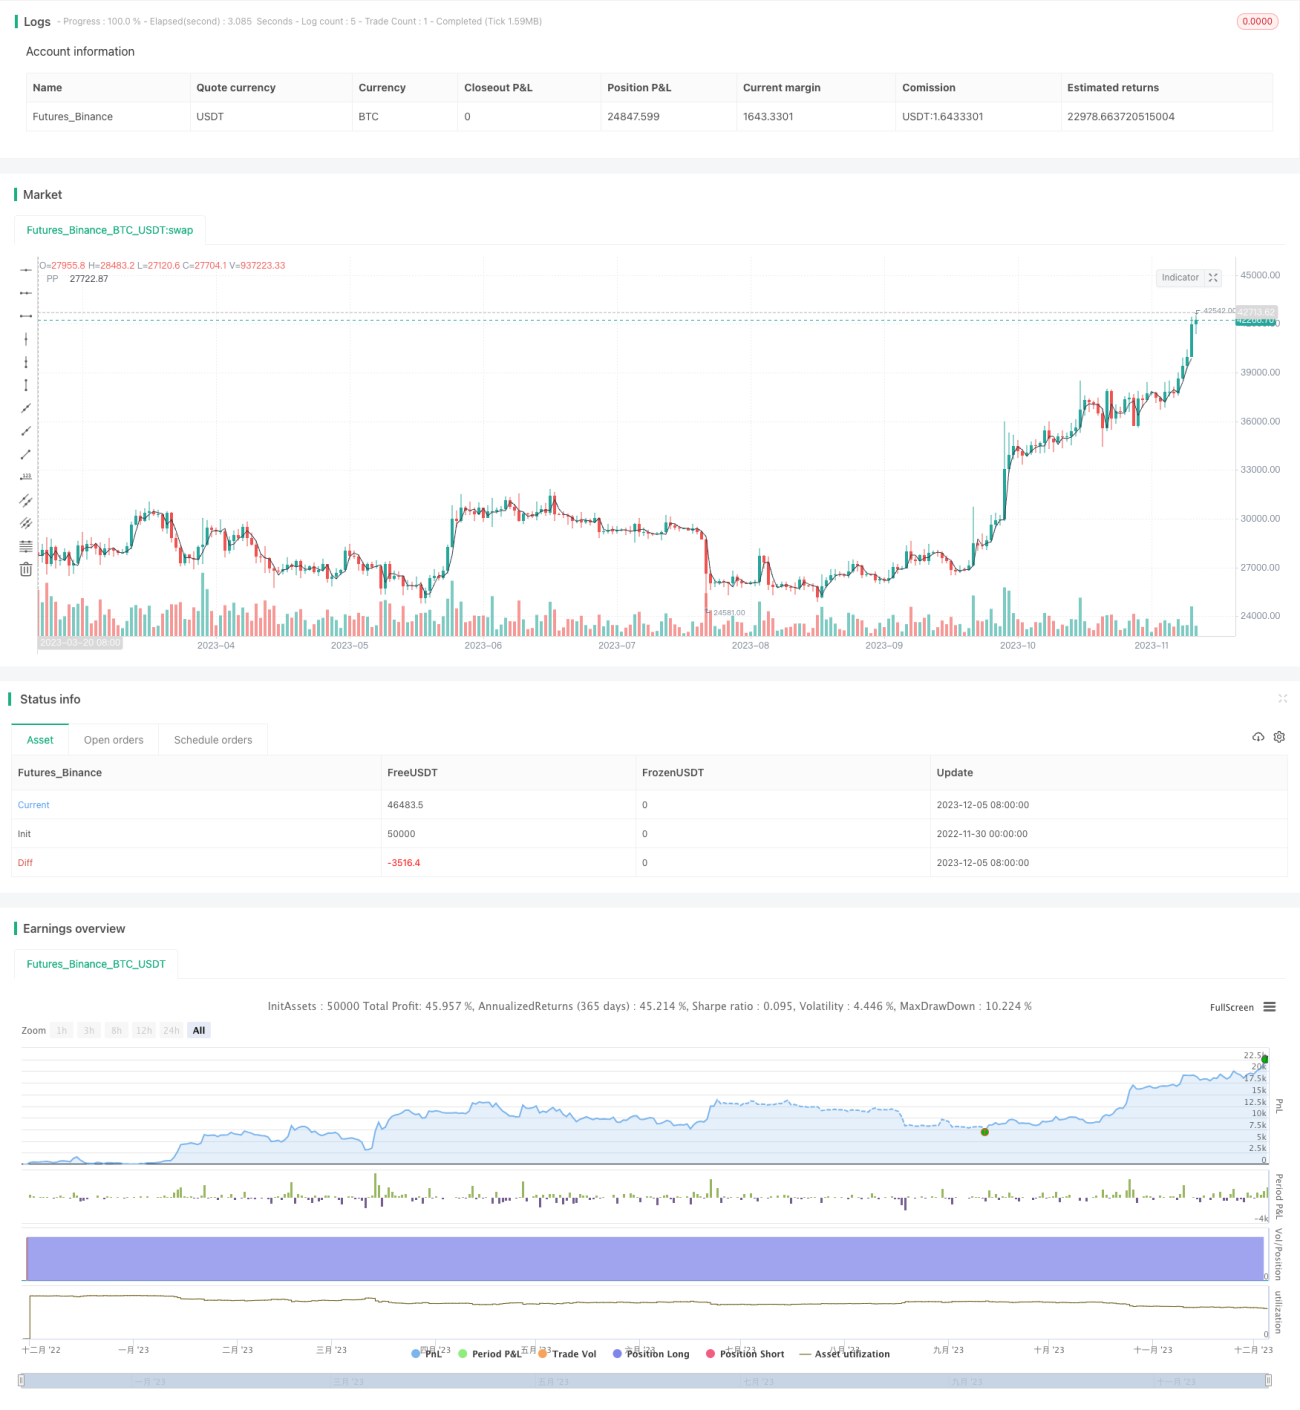
Código Fuente de la Estrategia
/*backtest
start: 2022-11-30 00:00:00
end: 2023-12-06 00:00:00
period: 1d
basePeriod: 1h
exchanges: [{"eid":"Futures_Binance","currency":"BTC_USDT"}]
*/

// This source code is subject to the terms of the Mozilla Public License 2.0 at https://mozilla.org/MPL/2.0/
// © arameshraju
//Reference credit goes to All


//@version=4
strategy("ARR-Pivote-India-Stategy",shorttitle="ARR-PP-Ind", overlay=true)

// This source code is subject to the terms of the Mozilla Public License 2.0 at https://mozilla.org/MPL/2.0/
// © arameshraju
//User Input
showPrevDayHighLow = input(false, title="Show previous day's High & Low(PDH/PDL)", type=input.bool)
showPivoteLine = input(true, title="Show Pivot Point(PP)", type=input.bool)
showPivoteR1Line = input(false, title="Show Pivot Point Resistance (R1)", type=input.bool)
showPivoteS1Line = input(false, title="Show Pivot Point Support (S1)", type=input.bool)
tradeLong = input(true, title="Trade on Long Entry", type=input.bool)
tradeShort = input(false, title="Trade on Short Entry", type=input.bool)
maxLoss = input(0.5, title="Max Loss on one Trade", type=input.float)
tradeOn=input(title="Trade base Level", type=input.string,
     options=["PP", "PDH", "PDL","R1","S1"], defval="PP")

sessSpec = input("0915-1530", title="Session time", type=input.session)

// Defaults
// Colors
cColor = color.black
rColor = color.red
sColor = color.green

// Line style & Transparency
lStyle = plot.style_line
lTransp = 35

// Get High & Low
getSeries(_e, _timeFrame) => security(syminfo.tickerid, _timeFrame, _e, lookahead=barmerge.lookahead_on) 

is_newbar(res, sess) =>
    t = time(res, sess)
    na(t[1]) and not na(t) or t[1] < t

newbar = is_newbar("375", sessSpec)
// Today's Session Start timestamp
y = year(timenow)
m = month(timenow)
d = dayofmonth(timenow)

// Start & End time for Today
start = timestamp(y, m, d, 09, 15)
end = start + 86400000


PrevDayHigh = getSeries(high[1], 'D')
PrevDayLow = getSeries(low[1], 'D')
PrevDayClose = getSeries(close[1], 'D')

PivoteLine=(PrevDayHigh+PrevDayLow+PrevDayClose) /3
PivoteR1=(PivoteLine*2) -PrevDayLow

PivoteS1=(PivoteLine*2) -PrevDayHigh

orbPrevDayOpen = getSeries(open[1], 'D')
orbPrevDayClose = getSeries(close[1], 'D')

// //Preview Day High line
// _pdh = line.new(start, PrevDayHigh, end, PrevDayHigh, xloc.bar_time, color=color.red, style=line.style_solid, width=2)
// line.delete(_pdh[1])
// _pdl = line.new(start, PrevDayLow, end, PrevDayLow, xloc.bar_time, color=color.green, style=line.style_solid, width=2)
// line.delete(_pdl[1])
// _Pp = line.new(start, PrevDayLow, end, PrevDayLow, xloc.bar_time, color=color.green, style=line.style_dashed, width=2)
// line.delete(_Pp[1])


// //Previous Day Low Line
// l_pdh = label.new(start, PrevDayHigh, text="PD", xloc=xloc.bar_time, textcolor=rColor, style=label.style_none)
// label.delete(l_pdh[1])
// l_pdl = label.new(start, PrevDayLow, text="PD", xloc=xloc.bar_time, textcolor=sColor, style=label.style_none)
// label.delete(l_pdl[1])

// //Pivote Line

// l_pp = label.new(start, PivoteLine, text="PP", xloc=xloc.bar_time, textcolor=color.black, style=label.style_none)
// label.delete(l_pp[1])
// l_R1 = label.new(start, PivoteR1, text="R1", xloc=xloc.bar_time, textcolor=color.fuchsia, style=label.style_none)
// label.delete(l_pp[1])
// l_SR = label.new(start, PivoteS1, text="S2", xloc=xloc.bar_time, textcolor=color.navy, style=label.style_none)
// label.delete(l_pp[1])


plot(showPrevDayHighLow?PrevDayHigh:na , title=' PDH', color=rColor)
plot(showPrevDayHighLow?PrevDayLow:na, title=' PDL', color=sColor)
plot(showPivoteLine?PivoteLine:na, title=' PP', color=color.black)
plot(showPivoteR1Line?PivoteR1:na, title=' R1', color=color.fuchsia)
plot(showPivoteS1Line?PivoteS1:na, title=' S1', color=color.navy)

// Today's Session Start timestamp
// Start & End time for Today
//endTime = timestamp(t, m, d, 15, 00)

tradeEventPrice= if string("PDH")==tradeOn 
    PrevDayHigh
else if string("PDL")==tradeOn
    PrevDayLow
else if string("R1")==tradeOn
    PivoteR1
else if string("S1")==tradeOn
    PivoteS1
else
    PivoteLine


//tradeEventPrice=PrevDayHigh

if (open < tradeEventPrice) and ( close >tradeEventPrice ) and ( hour < 13 ) and tradeLong
	strategy.entry("buy", strategy.long, 1, when=strategy.position_size <= 0)

if (open > tradeEventPrice) and ( close <tradeEventPrice ) and ( hour < 13 ) and  tradeShort
	strategy.entry("Sell", strategy.short, 1, when=strategy.position_size <= 0)

mxloss=orbPrevDayClose*maxLoss

strategy.exit("exit", "buy",  loss = mxloss) 
strategy.exit("exit", "Sell",  loss = mxloss) 


strategy.close_all(when =   hour == 15   , comment = "close all entries")