Estrategia de backtesting del oscilador arcoíris
Descripción general
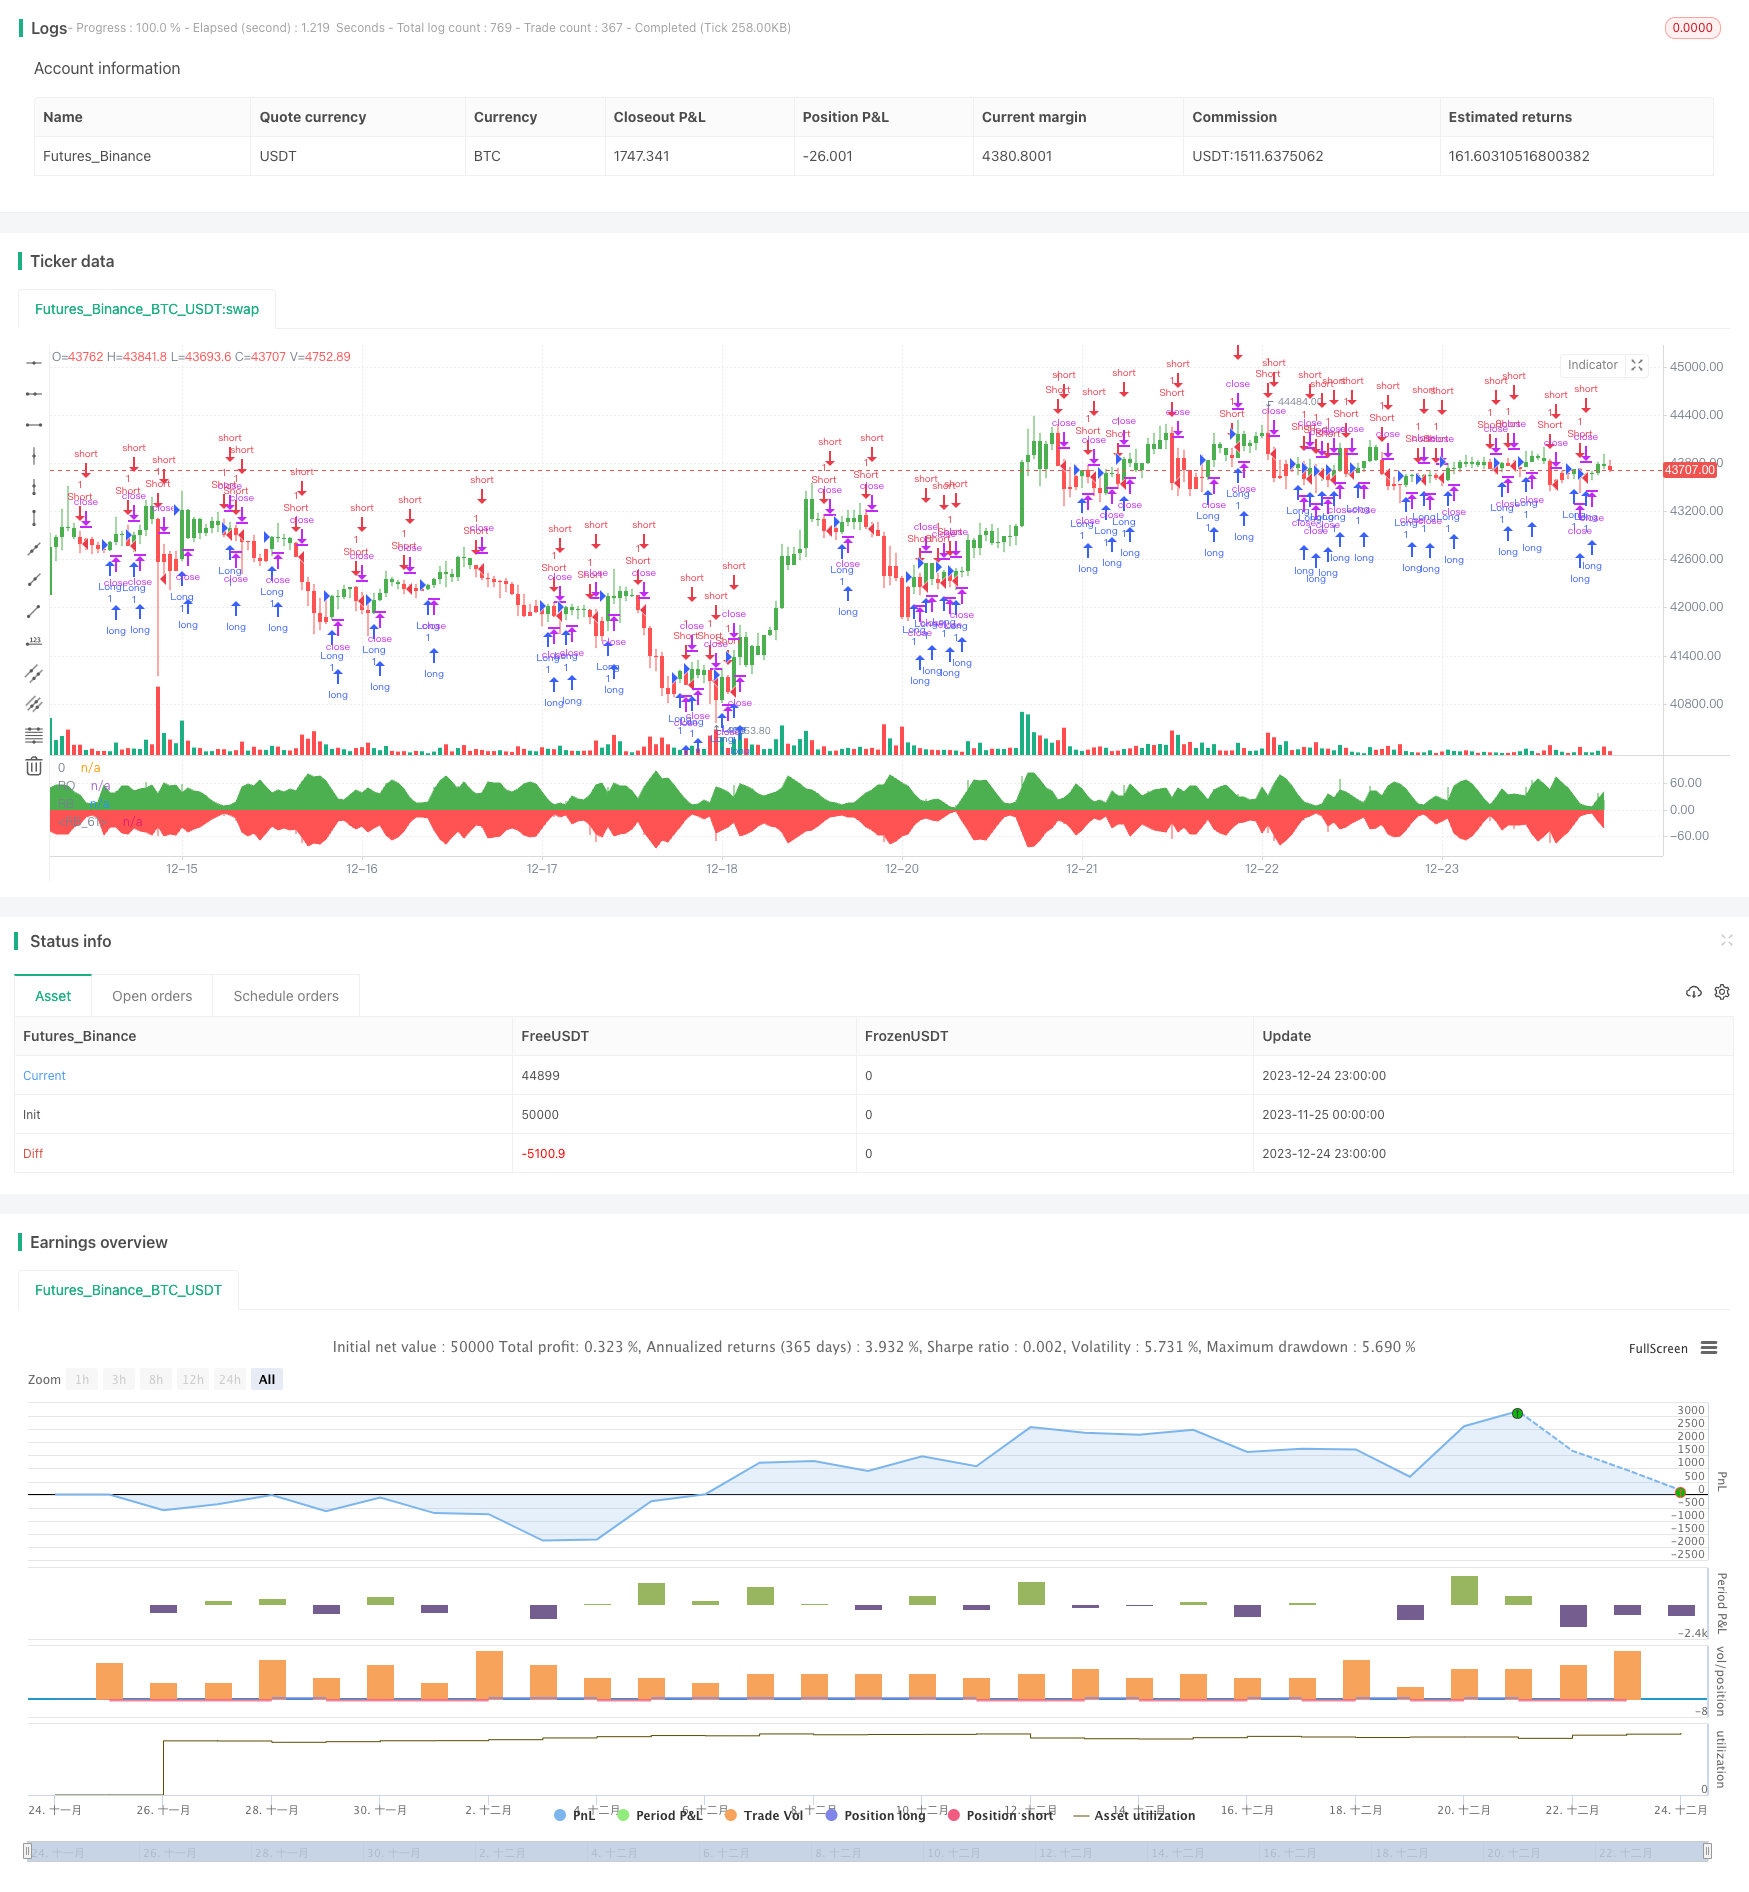
La estrategia de retroalimentación del oscilador del arco iris es una estrategia de negociación cuantitativa basada en el indicador del oscilador del arco iris. La estrategia determina la dirección y la intensidad de la tendencia del mercado calculando el grado de desviación entre el precio de las acciones y la línea media para determinar la dirección de las posiciones largas y cortas.
Principio de estrategia
El indicador central de la estrategia es el oscilador del arco iris, cuya fórmula de cálculo es la siguiente:
RO = 100 * ((收盘价 - 10日移动平均线) / (最高价的最高值 - 最低价的最低值))
El promedio móvil de 10 días es el promedio móvil simple de los precios de cierre de 10 períodos. El indicador refleja la desviación de los precios con respecto a su propia línea media. Cuando el RO > 0 representa que el precio está por encima de la línea media, es una señal de alza; cuando el RO < 0, representa que el precio está por debajo de la línea media, es una señal de baja.
La estrategia también calcula un indicador auxiliar, el ancho de banda (Bandwidth, RB), cuya fórmula de cálculo es:
RB = 100 * ((均线的最高值 - 均线的最低值) / (最高价的最高值 - 最低价的最低值))
RB refleja la anchura entre las líneas medias. Cuanto mayor es el RB, mayor es la volatilidad de los precios, y por el contrario, la estabilidad de los precios. El indicador RB se puede usar para determinar la estabilidad del mercado.
De acuerdo con los valores de los indicadores RO y RB, la estrategia determina el grado de desviación de los precios y la estabilidad del mercado para generar señales de negociación de posiciones largas y cortas.
Ventajas estratégicas
La estrategia tiene las siguientes ventajas:
- El juicio basado en dos indicadores evita la limitación de un solo indicador.
- Se puede juzgar el movimiento de los precios y la estabilidad del mercado al mismo tiempo.
- La computación es simple, fácil de entender e implementar.
- Indicadores de visualización, que forman un efecto de brillo de arco iris y son fáciles de leer.
Riesgo estratégico
La estrategia también tiene sus riesgos:
- Los parámetros incorrectos de los indicadores RO y RB pueden causar errores en las señales de negociación.
- Las estrategias de doble línea son propensas a generar señales erróneas y frecuentes operaciones.
- El ciclo de recuperación y la selección incorrecta de variedades pueden afectar la eficacia de la estrategia.
- Sin tener en cuenta el costo de la transacción, el disco duro podría no ser tan efectivo.
Respuesta:
- Optimización de los parámetros de los indicadores RO y RB.
- Se añaden las condiciones de filtración para evitar transacciones frecuentes.
- Seleccione el ciclo y la variedad adecuados.
- Calcular y considerar el costo de la transacción.
Optimización de la estrategia
La estrategia también puede ser optimizada en los siguientes aspectos:
- La función Smooth se añade al indicador RO para evitar una fuerte fluctuación del indicador.
- Acompáñese con una estrategia de stop loss para controlar las pérdidas individuales.
- La combinación de otros indicadores puede mejorar la probabilidad de obtener ganancias.
- Aumentar los modelos de aprendizaje automático para hacer predicciones y evaluar el efecto de los indicadores.
- Optimización de los parámetros de las diferentes variedades para mejorar la adaptabilidad.
Resumir
La estrategia de retroalimentación del oscilante del arco iris determina la tendencia y la estabilidad del mercado mediante el cálculo de la relación de desviación entre el precio y la línea media, con el fin de operar en posiciones largas y cortas. La estrategia es intuitiva, fácil de leer, sencilla de implementar y tiene cierto valor práctico.
/*backtest
start: 2023-11-25 00:00:00
end: 2023-12-25 00:00:00
period: 1h
basePeriod: 15m
exchanges: [{"eid":"Futures_Binance","currency":"BTC_USDT"}]
*/

//@version=2
////////////////////////////////////////////////////////////
//  Copyright by HPotter v1.0 18/03/2018
// Ever since the people concluded that stock market price movements are not
// random or chaotic, but follow specific trends that can be forecasted, they
// tried to develop different tools or procedures that could help them identify
// those trends. And one of those financial indicators is the Rainbow Oscillator
// Indicator. The Rainbow Oscillator Indicator is relatively new, originally
// introduced in 1997, and it is used to forecast the changes of trend direction.
//
// As market prices go up and down, the oscillator appears as a direction of the
// trend, but also as the safety of the market and the depth of that trend. As
// the rainbow grows in width, the current trend gives signs of continuity, and
// if the value of the oscillator goes beyond 80, the market becomes more and more
// unstable, being prone to a sudden reversal. When prices move towards the rainbow
// and the oscillator becomes more and more flat, the market tends to remain more
// stable and the bandwidth decreases. Still, if the oscillator value goes below 20,
// the market is again, prone to sudden reversals. The safest bandwidth value where
// the market is stable is between 20 and 80, in the Rainbow Oscillator indicator value.
// The depth a certain price has on a chart and into the rainbow can be used to judge
// the strength of the move.
//
// You can change long to short in the Input Settings
// WARNING:
//  - For purpose educate only
//  - This script to change bars colors.
////////////////////////////////////////////////////////////
strategy(title="Rainbow Oscillator Backtest")
Length = input(2, minval=1)
LengthHHLL = input(10, minval=2, title="HHV/LLV Lookback")
reverse = input(false, title="Trade reverse")
xMA1 = sma(close, Length)
xMA2 = sma(xMA1, Length)
xMA3 = sma(xMA2, Length)
xMA4 = sma(xMA3, Length)
xMA5 = sma(xMA4, Length)
xMA6 = sma(xMA5, Length)
xMA7 = sma(xMA6, Length)
xMA8 = sma(xMA7, Length)
xMA9 = sma(xMA8, Length)
xMA10 = sma(xMA9, Length)
xHH = highest(close, LengthHHLL)
xLL = lowest(close, LengthHHLL)
xHHMAs = max(xMA1,max(xMA2,max(xMA3,max(xMA4,max(xMA5,max(xMA6,max(xMA7,max(xMA8,max(xMA9,xMA10)))))))))
xLLMAs = min(xMA1,min(xMA2,min(xMA3,min(xMA4,min(xMA5,min(xMA6,min(xMA7,min(xMA8,min(xMA9,xMA10)))))))))
xRBO = 100 * ((close - ((xMA1+xMA2+xMA3+xMA4+xMA5+xMA6+xMA7+xMA8+xMA9+xMA10) / 10)) / (xHH - xLL))
xRB = 100 * ((xHHMAs - xLLMAs) / (xHH - xLL))
clr = iff(xRBO >= 0, green, red)
pos = iff(xRBO > 0, 1,
       iff(xRBO < 0, -1, nz(pos[1], 0)))
possig = iff(reverse and pos == 1, -1,
          iff(reverse and pos == -1, 1, pos))
if (possig == 1)
    strategy.entry("Long", strategy.long)
if (possig == -1)
    strategy.entry("Short", strategy.short)
barcolor(possig == -1 ? red: possig == 1 ? green : blue )
plot(xRBO, color=clr, title="RO", style= histogram, linewidth=2)
p0 = plot(0, color = gray, title="0")
p1 = plot(xRB, color=green, title="RB")
p2 = plot(-xRB, color=red, title="RB")
fill(p1, p0, color=green)
fill(p2, p0, color=red)