Estrategia de gestión de posiciones basada en la curva de capital
Descripción general de la estrategia
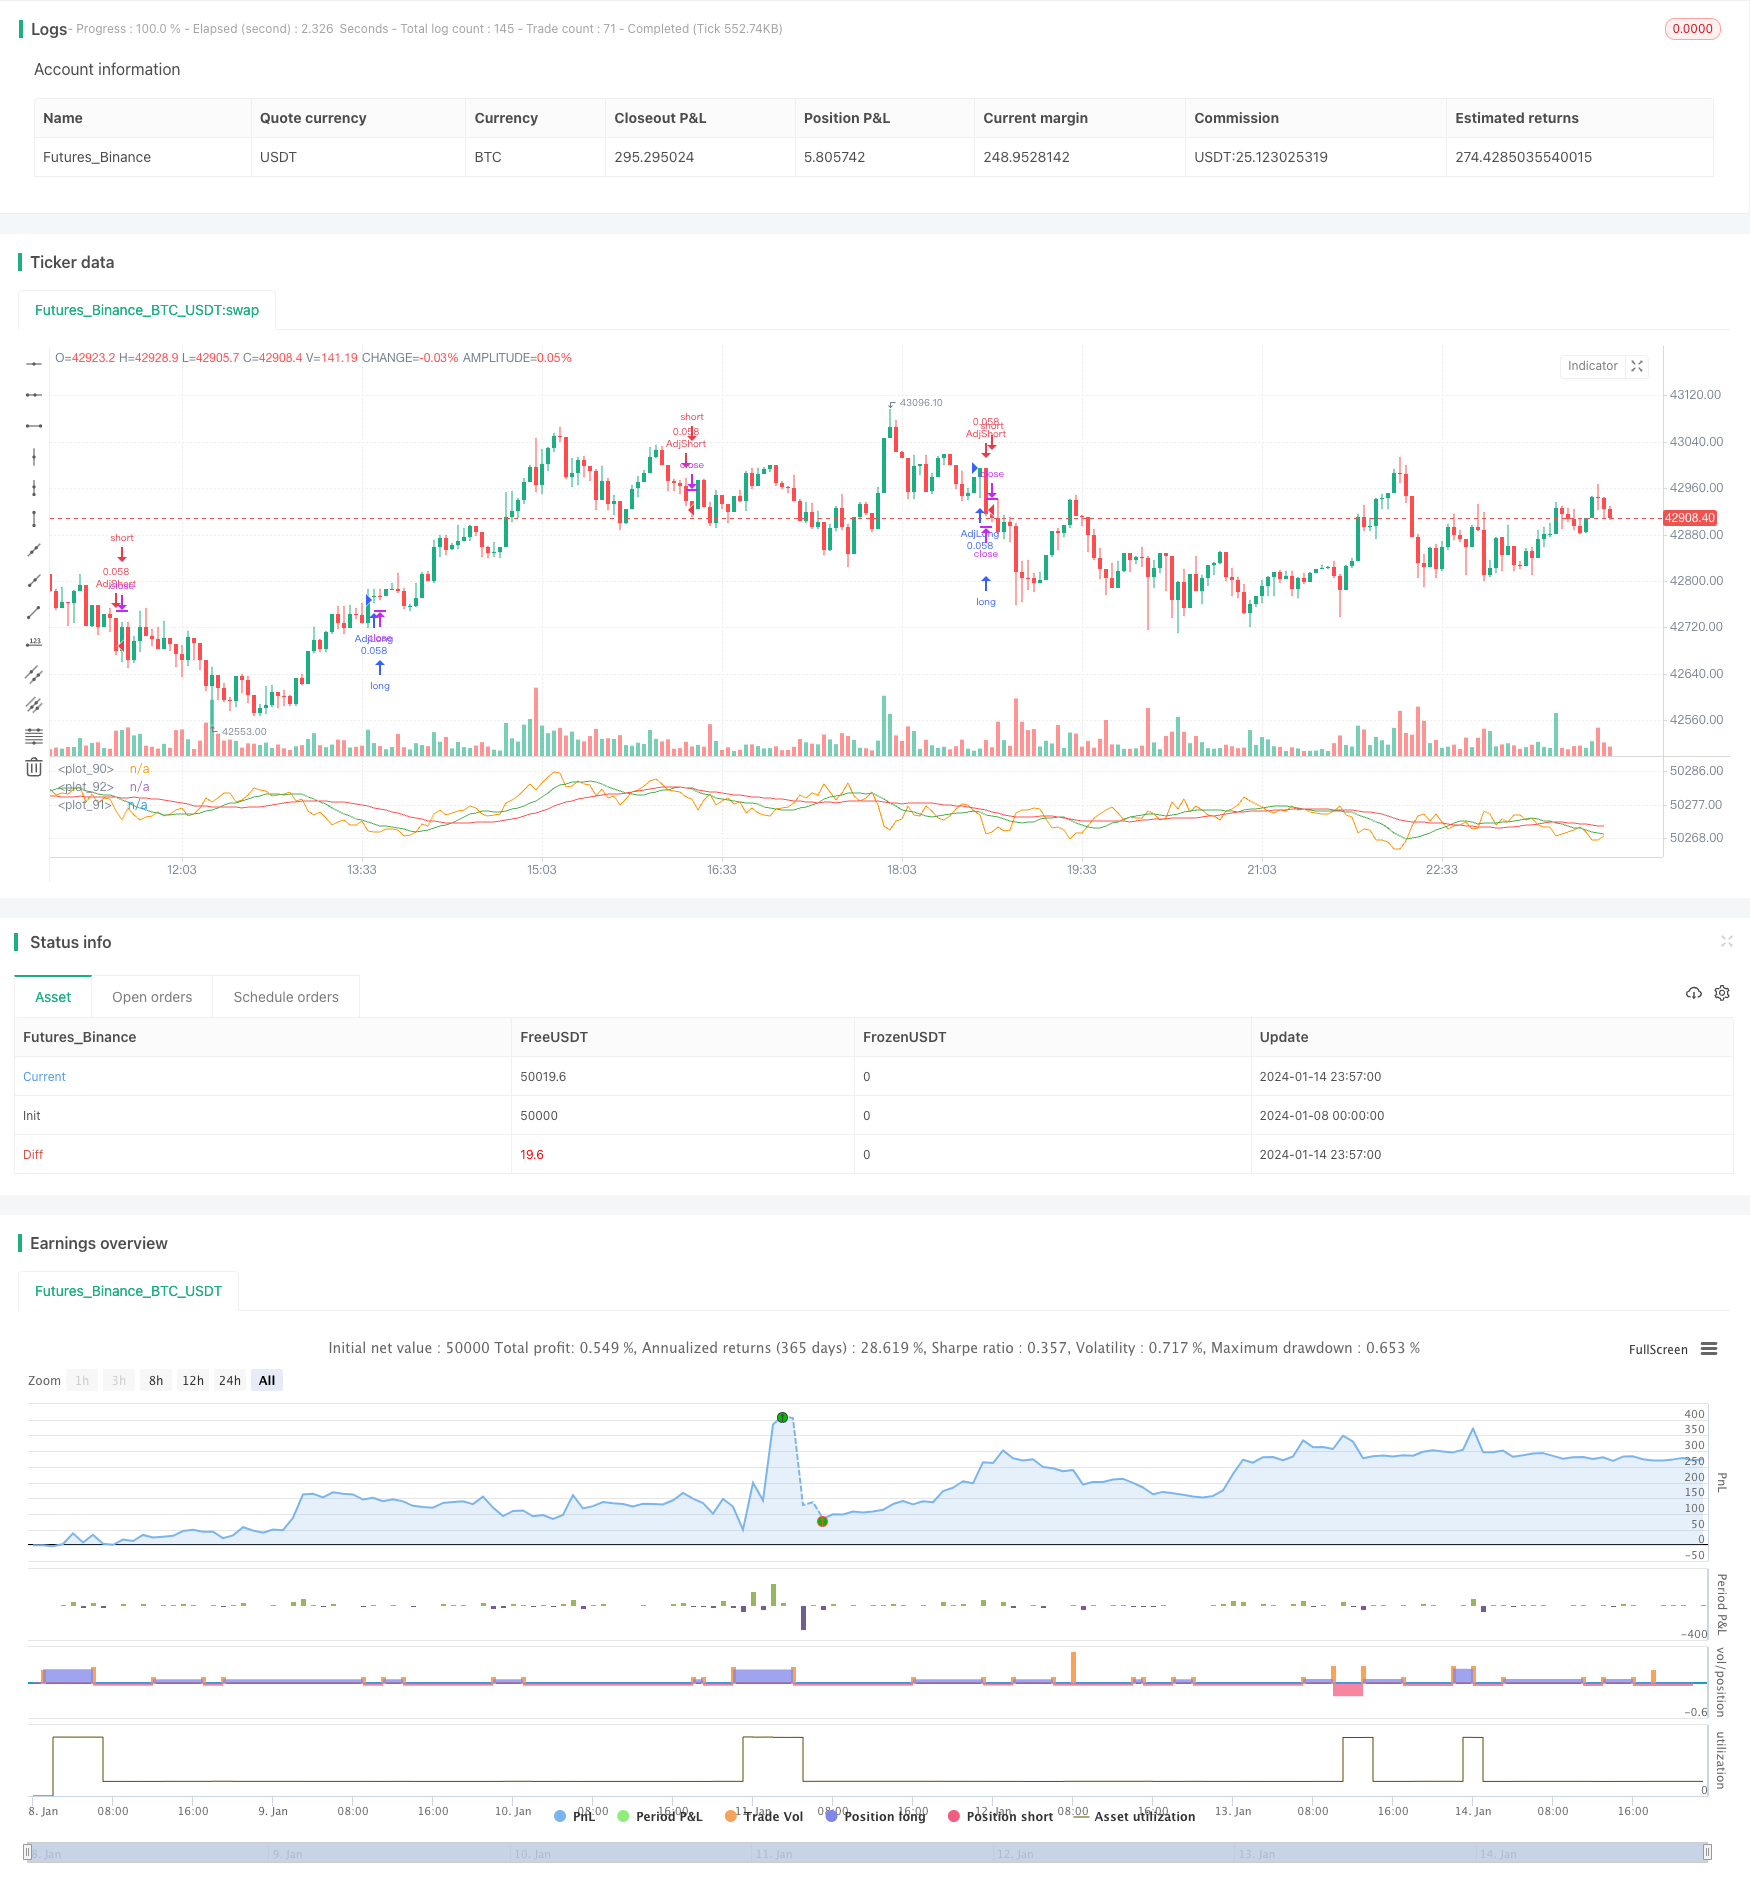
La idea central de esta estrategia es ajustar dinámicamente el tamaño de las posiciones en función de la evolución de la curva de capital, aumentar las posiciones en caso de ganancias y reducir las posiciones en caso de pérdidas para controlar el riesgo general. La estrategia combina al mismo tiempo el indicador de dinámica Chande, el indicador SuperTrend y el indicador de dinámica para identificar las señales de negociación.
Principio de estrategia
La estrategia utiliza dos maneras de determinar si la curva de capital está en una tendencia descendente: 1) calcular los promedios móviles simples rápidos y lentos de la curva de capital, y si el SMA rápido es inferior al SMA lento, juzgarlo como bajista; 2) calcular la curva de capital con el promedio móvil simple de su propio período más largo, y si la curva de capital es inferior a ese promedio móvil, juzgarlo como bajista.
Cuando se juzga que la curva de capital está bajando, las posiciones se reducen o aumentan en cierta proporción según la configuración. Por ejemplo, si se establece una reducción del 50%, las posiciones del 10% se reducen al 5%. La estrategia hace que la escala de la posición se aumente cuando se gana y se reduzca la escala de la posición cuando se pierde, para controlar el riesgo general.
Ventajas estratégicas
- El uso de la curva de capital para determinar las pérdidas generales del sistema y el ajuste dinámico de las posiciones ayuda a controlar el riesgo
- La combinación de varios indicadores para determinar la entrada puede mejorar la probabilidad de ganar
- Parámetros para ajustar posiciones personalizadas para diferentes preferencias de riesgo
Riesgo estratégico
- Las pérdidas aumentan cuando las posiciones aumentan
- Los parámetros mal configurados pueden llevar a un ajuste de posición demasiado radical
- La gestión de posiciones no puede evitar completamente el riesgo sistémico
Optimización de las ideas
- Prueba de la eficacia de los parámetros de ajuste de diferentes posiciones
- Prueba con otras combinaciones de indicadores para determinar la curva de capital
- Optimizar las condiciones de ingreso y aumentar la tasa de éxito
Resumir
Esta estrategia tiene una idea general clara, utiliza la curva de capital para ajustar las posiciones de manera dinámica, puede controlar el riesgo de manera efectiva y vale la pena realizar pruebas y optimizaciones adicionales. La configuración de parámetros y la estrategia de parada de pérdidas también deben considerarse adecuadamente para evitar el riesgo de operaciones radicales.
/*backtest
start: 2024-01-08 00:00:00
end: 2024-01-15 00:00:00
period: 3m
basePeriod: 1m
exchanges: [{"eid":"Futures_Binance","currency":"BTC_USDT"}]
*/

// This source code is subject to the terms of the Mozilla Public License 2.0 at https://mozilla.org/MPL/2.0/
// © shardison
//@version=5

//EXPLANATION
//"Trading the equity curve" as a risk management method is the
//process of acting on trade signals depending on whether a system’s performance
//is indicating the strategy is in a profitable or losing phase.
//The point of managing equity curve is to minimize risk in trading when the equity curve is  in a downtrend.
//This strategy has two modes to determine the equity curve downtrend:
//By creating two simple moving averages of a portfolio's equity curve - a short-term
//and a longer-term one - and acting on their crossings. If the fast SMA is below
//the slow SMA, equity downtrend is detected (smafastequity < smaslowequity).
//The second method is by using the crossings of equity itself with the longer-period SMA (equity < smasloweequity).
//When "Reduce size by %" is active, the position size will be reduced by a specified percentage
//if the equity is "under water" according to a selected rule. If you're a risk seeker, select "Increase size by %"
//- for some robust systems, it could help overcome their small drawdowns quicker.

strategy("Use Trading the Equity Curve Postion Sizing", shorttitle="TEC", default_qty_type = strategy.percent_of_equity, default_qty_value = 10, initial_capital = 100000)

//TRADING THE EQUITY CURVE INPUTS
useTEC           = input.bool(true, title="Use Trading the Equity Curve Position Sizing")
defulttraderule  = useTEC ? false: true
initialsize      = input.float(defval=10.0, title="Initial % Equity")
slowequitylength = input.int(25, title="Slow SMA Period")
fastequitylength = input.int(9, title="Fast SMA Period")
seedequity = 100000 * .10
if strategy.equity == 0
    seedequity
else
    strategy.equity
slowequityseed   = strategy.equity > seedequity ? strategy.equity : seedequity
fastequityseed   = strategy.equity > seedequity ? strategy.equity : seedequity
smaslowequity    = ta.sma(slowequityseed, slowequitylength)
smafastequity    = ta.sma(fastequityseed, fastequitylength)
equitycalc       = input.bool(true, title="Use Fast/Slow Avg", tooltip="Fast Equity Avg is below Slow---otherwise if unchecked uses Slow Equity Avg below Equity")
sizeadjstring    = input.string("Reduce size by (%)", title="Position Size Adjustment", options=["Reduce size by (%)","Increase size by (%)"])
sizeadjint       = input.int(50, title="Increase/Decrease % Equity by:")
equitydowntrendavgs = smafastequity < smaslowequity
slowequitylessequity = strategy.equity < smaslowequity

equitymethod = equitycalc ? equitydowntrendavgs : slowequitylessequity

if sizeadjstring == ("Reduce size by (%)")
    sizeadjdown = initialsize * (1 - (sizeadjint/100))
else
    sizeadjup = initialsize * (1 + (sizeadjint/100))
c = close
qty = 100000 * (initialsize / 100) / c
if useTEC and equitymethod
    if sizeadjstring == "Reduce size by (%)"
        qty := (strategy.equity * (initialsize / 100) * (1 - (sizeadjint/100))) / c
    else
        qty := (strategy.equity * (initialsize / 100) * (1 + (sizeadjint/100))) / c

//EXAMPLE TRADING STRATEGY INPUTS
CMO_Length = input.int(defval=9, minval=1, title='Chande Momentum Length')
CMO_Signal = input.int(defval=10, minval=1, title='Chande Momentum Signal')

chandeMO = ta.cmo(close, CMO_Length)
cmosignal = ta.sma(chandeMO, CMO_Signal)

SuperTrend_atrPeriod = input.int(10, "SuperTrend ATR Length")
SuperTrend_Factor = input.float(3.0, "SuperTrend Factor", step = 0.01)
Momentum_Length = input.int(12, "Momentum Length")
price = close

mom0 = ta.mom(price, Momentum_Length)
mom1 = ta.mom( mom0, 1)
[supertrend, direction] = ta.supertrend(SuperTrend_Factor, SuperTrend_atrPeriod)
stupind = (direction < 0 ? supertrend : na)
stdownind = (direction < 0? na : supertrend)

//TRADING CONDITIONS
longConditiondefault = ta.crossover(chandeMO, cmosignal) and (mom0 > 0 and mom1 > 0 and close > stupind) and defulttraderule
if (longConditiondefault)
    strategy.entry("DefLong", strategy.long, qty=qty)

shortConditiondefault = ta.crossunder(chandeMO, cmosignal) and (mom0 < 0 and mom1 < 0 and close < stdownind) and defulttraderule
if (shortConditiondefault)
    strategy.entry("DefShort", strategy.short, qty=qty)

longCondition = ta.crossover(chandeMO, cmosignal) and (mom0 > 0 and mom1 > 0 and close > stupind) and useTEC
if (longCondition)
    strategy.entry("AdjLong", strategy.long, qty = qty)

shortCondition = ta.crossunder(chandeMO, cmosignal) and (mom0 < 0 and mom1 < 0 and close < stdownind) and useTEC
if (shortCondition)
    strategy.entry("AdjShort", strategy.short, qty = qty)
plot(strategy.equity)
plot(smaslowequity, color=color.new(color.red, 0))
plot(smafastequity, color=color.new(color.green, 0))