Basado en una estrategia de comercio de red dinámica
Descripción general
Esta estrategia permite la negociación de la red mediante la creación de varias órdenes de compra y venta paralelas dentro de un rango de precios, ajustando los rangos y líneas de la red según las fluctuaciones del mercado, para obtener ganancias.
Principio de estrategia
- Se puede configurar manualmente o se puede calcular automáticamente en función de los precios más bajos y más altos de los últimos tiempos.
- En función del número de cuadrículas configuradas, se calcula la anchura de los espacios entre las cuadrículas.
- Generar una matriz de precios de líneas de la red de un número correspondiente.
- Cuando el precio está por debajo de una línea de la grilla, se abre una cuenta por debajo de esa línea; cuando el precio está por encima de una línea de la grilla, se abre una cuenta en blanco por encima de esa línea.
- Ajuste dinámico de los límites superiores y inferiores de la rejilla, la anchura de los intervalos y los precios de las líneas de la rejilla para adaptarlos a los cambios en el mercado.
Análisis de las ventajas
- Se puede obtener ganancias estables en mercados horizontales y fluctuantes, sin influencias unilaterales.
- La configuración manual también es compatible con el cálculo automático de los rangos de la rejilla, y es muy adaptable.
- Se puede optimizar el rendimiento ajustando el número de grillas, el ancho de la grilla y la cantidad de encargos.
- El control de posición integrado permite controlar el riesgo.
- Apoya el ajuste dinámico del alcance de la grilla para una mayor adaptabilidad de la estrategia.
Análisis de riesgos
- En caso de una fuerte tendencia, puede haber grandes pérdidas.
- El número incorrecto de cuadrículas y posiciones puede aumentar el riesgo.
- El cálculo automático de las franjas de rejilla puede fallar en casos extremos.
La solución al riesgo:
- Optimización de los parámetros de la grilla y control estricto de la posición total.
- La estrategia de cierre antes de que se produzcan las grandes fluctuaciones
- En combinación con los indicadores de tendencia, evaluar la situación y, si es necesario, cerrar la estrategia.
Dirección de optimización
- Seleccionar el número óptimo de cuadrículas en combinación con las características del mercado y el tamaño del capital.
- Prueba de parámetros de cálculo automático de la grilla de optimización para diferentes períodos de tiempo.
- Optimizar el cálculo de la cantidad de encargos para obtener un rendimiento más estable.
- En combinación con otros indicadores para evaluar el comportamiento de las acciones, se establecen las condiciones para el cierre de la estrategia.
Resumir
La estrategia de trading de la cuadrícula dinámica se adapta a los cambios en el mercado mediante el ajuste dinámico de los parámetros de la cuadrícula, lo que permite obtener ganancias en el disco horizontal y el disco oscilante. Al mismo tiempo, la configuración de un control apropiado de la posición permite controlar el riesgo. La optimización de los parámetros de la cuadrícula y la combinación de indicadores de juicio de tendencias pueden mejorar aún más la estabilidad de la estrategia.
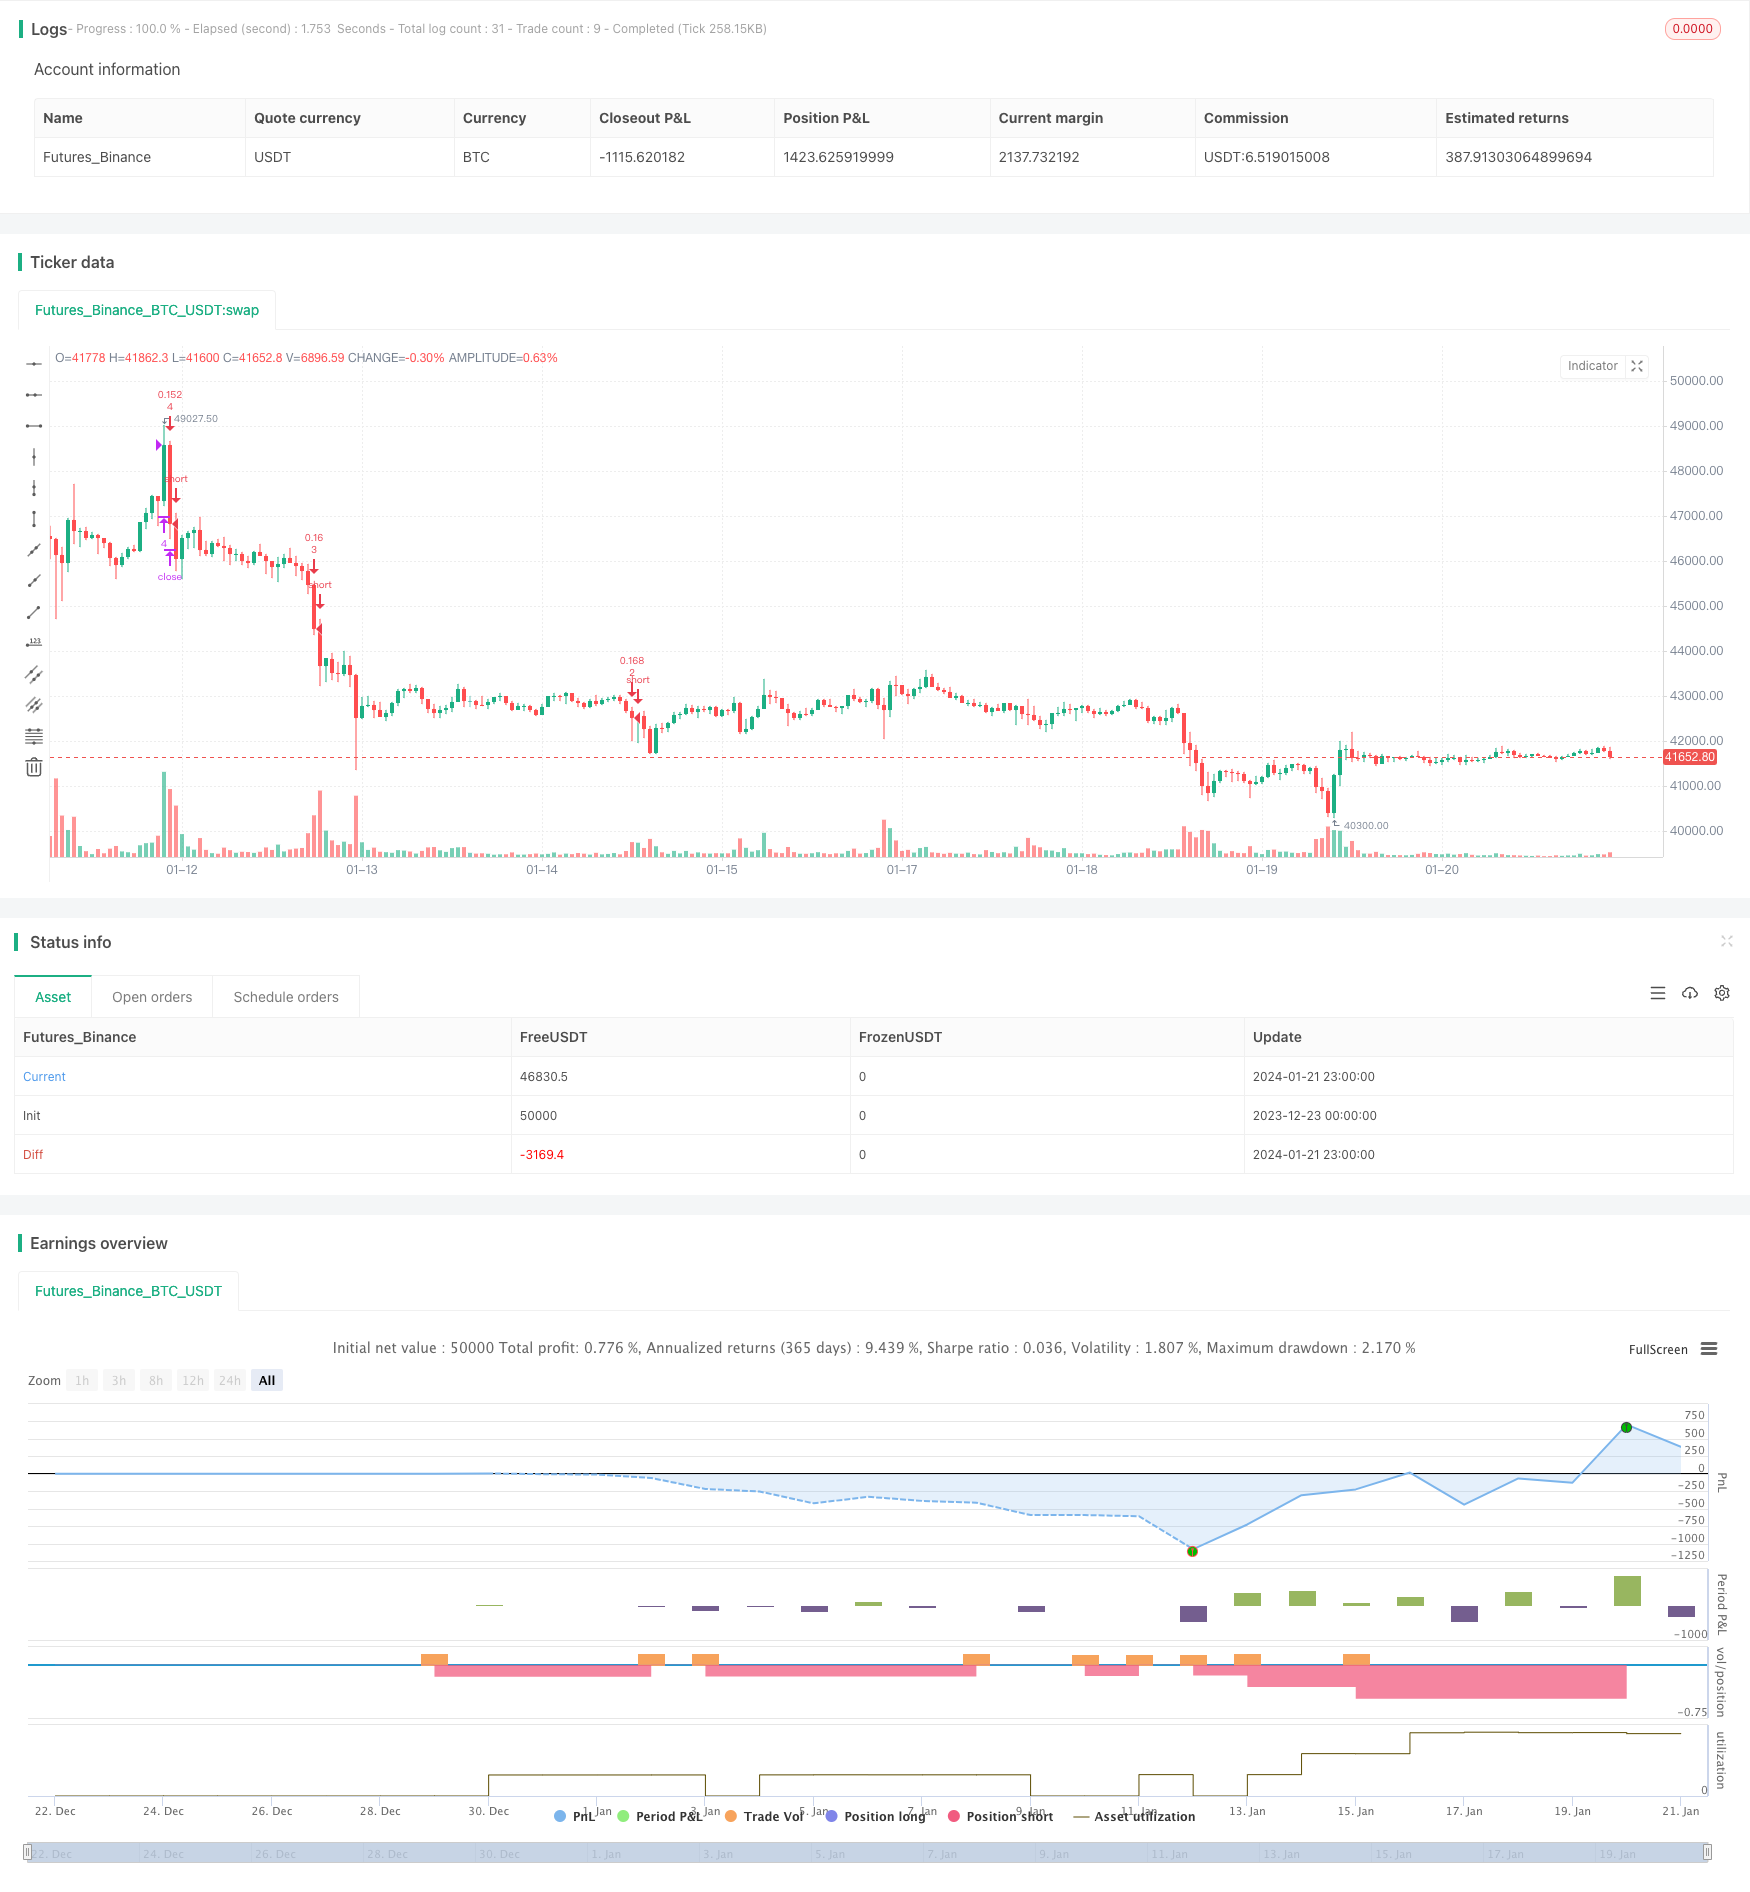
/*backtest
start: 2023-12-23 00:00:00
end: 2024-01-22 00:00:00
period: 1h
basePeriod: 15m
exchanges: [{"eid":"Futures_Binance","currency":"BTC_USDT"}]
*/

//@version=4
strategy("sarasa srinivasa kumar", overlay=true, pyramiding=14, close_entries_rule="ANY", default_qty_type=strategy.cash, initial_capital=100.0, currency="USD", commission_type=strategy.commission.percent, commission_value=0.1)
i_autoBounds    = input(group="Grid Bounds", title="Use Auto Bounds?", defval=true, type=input.bool)                             // calculate upper and lower bound of the grid automatically? This will theorhetically be less profitable, but will certainly require less attention
i_boundSrc      = input(group="Grid Bounds", title="(Auto) Bound Source", defval="Hi & Low", options=["Hi & Low", "Average"])     // should bounds of the auto grid be calculated from recent High & Low, or from a Simple Moving Average
i_boundLookback = input(group="Grid Bounds", title="(Auto) Bound Lookback", defval=250, type=input.integer, maxval=500, minval=0) // when calculating auto grid bounds, how far back should we look for a High & Low, or what should the length be of our sma
i_boundDev      = input(group="Grid Bounds", title="(Auto) Bound Deviation", defval=0.10, type=input.float, maxval=1, minval=-1)  // if sourcing auto bounds from High & Low, this percentage will (positive) widen or (negative) narrow the bound limits. If sourcing from Average, this is the deviation (up and down) from the sma, and CANNOT be negative.
i_upperBound    = input(group="Grid Bounds", title="(Auto) Upper Boundry", defval=0.285, type=input.float)                      // for manual grid bounds only. The upperbound price of your grid
i_lowerBound    = input(group="Grid Bounds", title="(Auto) Lower Boundry", defval=0.225, type=input.float)                      // for manual grid bounds only. The lowerbound price of your grid.
i_gridQty       = input(group="Grid Lines",  title="Grid Line Quantity", defval=8, maxval=15, minval=3, type=input.integer)       // how many grid lines are in your grid

f_getGridBounds(_bs, _bl, _bd, _up) =>
    if _bs == "Hi & Low"
        _up ? highest(close, _bl) * (1 + _bd) : lowest(close, _bl)  * (1 - _bd)
    else
        avg = sma(close, _bl)
        _up ? avg * (1 + _bd) : avg * (1 - _bd)

f_buildGrid(_lb, _gw, _gq) =>
    gridArr = array.new_float(0)
    for i=0 to _gq-1
        array.push(gridArr, _lb+(_gw*i))
    gridArr

f_getNearGridLines(_gridArr, _price) =>
    arr = array.new_int(3)
    for i = 0 to array.size(_gridArr)-1
        if array.get(_gridArr, i) > _price
            array.set(arr, 0, i == array.size(_gridArr)-1 ? i : i+1)
            array.set(arr, 1, i == 0 ? i : i-1)
            break
    arr

var upperBound      = i_autoBounds ? f_getGridBounds(i_boundSrc, i_boundLookback, i_boundDev, true) : i_upperBound  // upperbound of our grid
var lowerBound      = i_autoBounds ? f_getGridBounds(i_boundSrc, i_boundLookback, i_boundDev, false) : i_lowerBound // lowerbound of our grid
var gridWidth       = (upperBound - lowerBound)/(i_gridQty-1)                                                       // space between lines in our grid
var gridLineArr     = f_buildGrid(lowerBound, gridWidth, i_gridQty)                                                 // an array of prices that correspond to our grid lines
var orderArr        = array.new_bool(i_gridQty, false)                                                              // a boolean array that indicates if there is an open order corresponding to each grid line

var closeLineArr    = f_getNearGridLines(gridLineArr, close)                                                        // for plotting purposes - an array of 2 indices that correspond to grid lines near price
var nearTopGridLine = array.get(closeLineArr, 0)                                                                    // for plotting purposes - the index (in our grid line array) of the closest grid line above current price
var nearBotGridLine = array.get(closeLineArr, 1)                                                                    // for plotting purposes - the index (in our grid line array) of the closest grid line below current price
strategy.initial_capital = 50000
for i = 0 to (array.size(gridLineArr) - 1)
    if close < array.get(gridLineArr, i) and not array.get(orderArr, i) and i < (array.size(gridLineArr) - 1)
        buyId = i
        array.set(orderArr, buyId, true)
        strategy.entry(id=tostring(buyId), long=true, qty=(strategy.initial_capital/(i_gridQty-1))/close, comment="#"+tostring(buyId))
    if close > array.get(gridLineArr, i) and i != 0
        if array.get(orderArr, i-1)
            sellId = i-1
            array.set(orderArr, sellId, false)
            strategy.close(id=tostring(sellId), comment="#"+tostring(sellId))

if i_autoBounds
    upperBound  := f_getGridBounds(i_boundSrc, i_boundLookback, i_boundDev, true)
    lowerBound  := f_getGridBounds(i_boundSrc, i_boundLookback, i_boundDev, false)
    gridWidth   := (upperBound - lowerBound)/(i_gridQty-1)
    gridLineArr := f_buildGrid(lowerBound, gridWidth, i_gridQty)

closeLineArr    := f_getNearGridLines(gridLineArr, close)
nearTopGridLine := array.get(closeLineArr, 0)
nearBotGridLine := array.get(closeLineArr, 1)