Estrategia de contracción del impulso del oso perezoso
Descripción general
La estrategia de extorsión de la dinámica del oso es una estrategia de negociación cuantitativa que combina la banda de Bryn, el canal de Keltner y el indicador de dinámica. Utiliza las bandas de Bryn y el canal de Keltner para determinar si el mercado actual está en estado de extorsión y luego combina la generación de señales de negociación con el indicador de dinámica.
La principal ventaja de esta estrategia es que se puede identificar automáticamente el comienzo de la tendencia y, junto con los indicadores de dinámica, determinar el momento de entrada. Sin embargo, también existe un cierto riesgo que requiere la optimización de los parámetros para diferentes variedades.
Principio de estrategia
La estrategia de extorsión de la fuerza de los osos fue evaluada en base a los siguientes tres indicadores:
- Las Bandas de Bollinger: contienen el medio, el superior y el inferior
- Los canales de Keltner: incluyen el tren central, el tren superior y el tren inferior
- Indicador de Momentum: diferencia entre el precio actual y el precio de hace n días
Cuando la banda de Brin es más baja que la banda de Keltner y la banda de Brin es más alta que la banda de Keltner, consideramos que el mercado está en un estado de expansión. Esto generalmente significa que la tendencia actual está por comenzar.
Para determinar el momento de entrada, utilizamos un indicador de dinámica para determinar la velocidad de cambio del precio. Generamos una señal de compra cuando la dinámica se eleva por encima de su promedio; generamos una señal de venta cuando la dinámica baja por debajo de su promedio.
Análisis de las ventajas estratégicas
Las principales ventajas de la estrategia de extorsión de la dinámica de los osos son:
- El tiempo de inicio de una tendencia, y la entrada temprana.
- Combine varios indicadores para juzgar y evitar falsas señales
- La tendencia y la inversión de las dos formas de negociación
- Parámetros personalizables, optimizados para diferentes variedades
Análisis de riesgos
La estrategia de extorsión de la dinámica de los osos rojos también tiene ciertos riesgos:
- Las señales falsas en el cinturón de Brin y en el canal Keltner son más probables.
- El índice de dinámica es inestable y puede haber perdido el punto de entrada óptimo.
- Necesidad de optimizar los parámetros, de lo contrario no funcionará bien
- Efecto más correlacionado con la variedad comercializada
Para reducir el riesgo, se recomienda optimizar los parámetros de longitud de la banda de Bryn y el canal de Keltner, ajustar los puntos de parada, elegir las variedades de operaciones con mayor liquidez y verificarlas en combinación con otros indicadores.
Dirección de optimización de la estrategia
Para mejorar aún más la eficacia de la estrategia de extorsión de la fuerza de los osos rojos, las principales direcciones de optimización son:
- Combinaciones de parámetros para probar diferentes variedades y períodos
- Optimización de la longitud de la franja de Brin y el canal de Keltner
- Optimización de la longitud del indicador de movimiento
- Estrategias de detención de pérdidas diferentes para las unidades de más y de menos
- Añadir otros indicadores para la verificación de señales
A través de pruebas y optimizaciones multidireccionales, se puede aumentar considerablemente la probabilidad de éxito y la rentabilidad de la estrategia.
Resumir
La estrategia de extorsión dinámica de los osos rojos integra una gran cantidad de indicadores que permiten identificar con eficacia el momento en que comienzan las tendencias. Sin embargo, también existe un cierto riesgo que requiere la optimización de los parámetros para las diferentes variedades de operaciones. Mediante la prueba y optimización continuas, la estrategia puede convertirse en un sistema de negociación algorítmica eficiente.
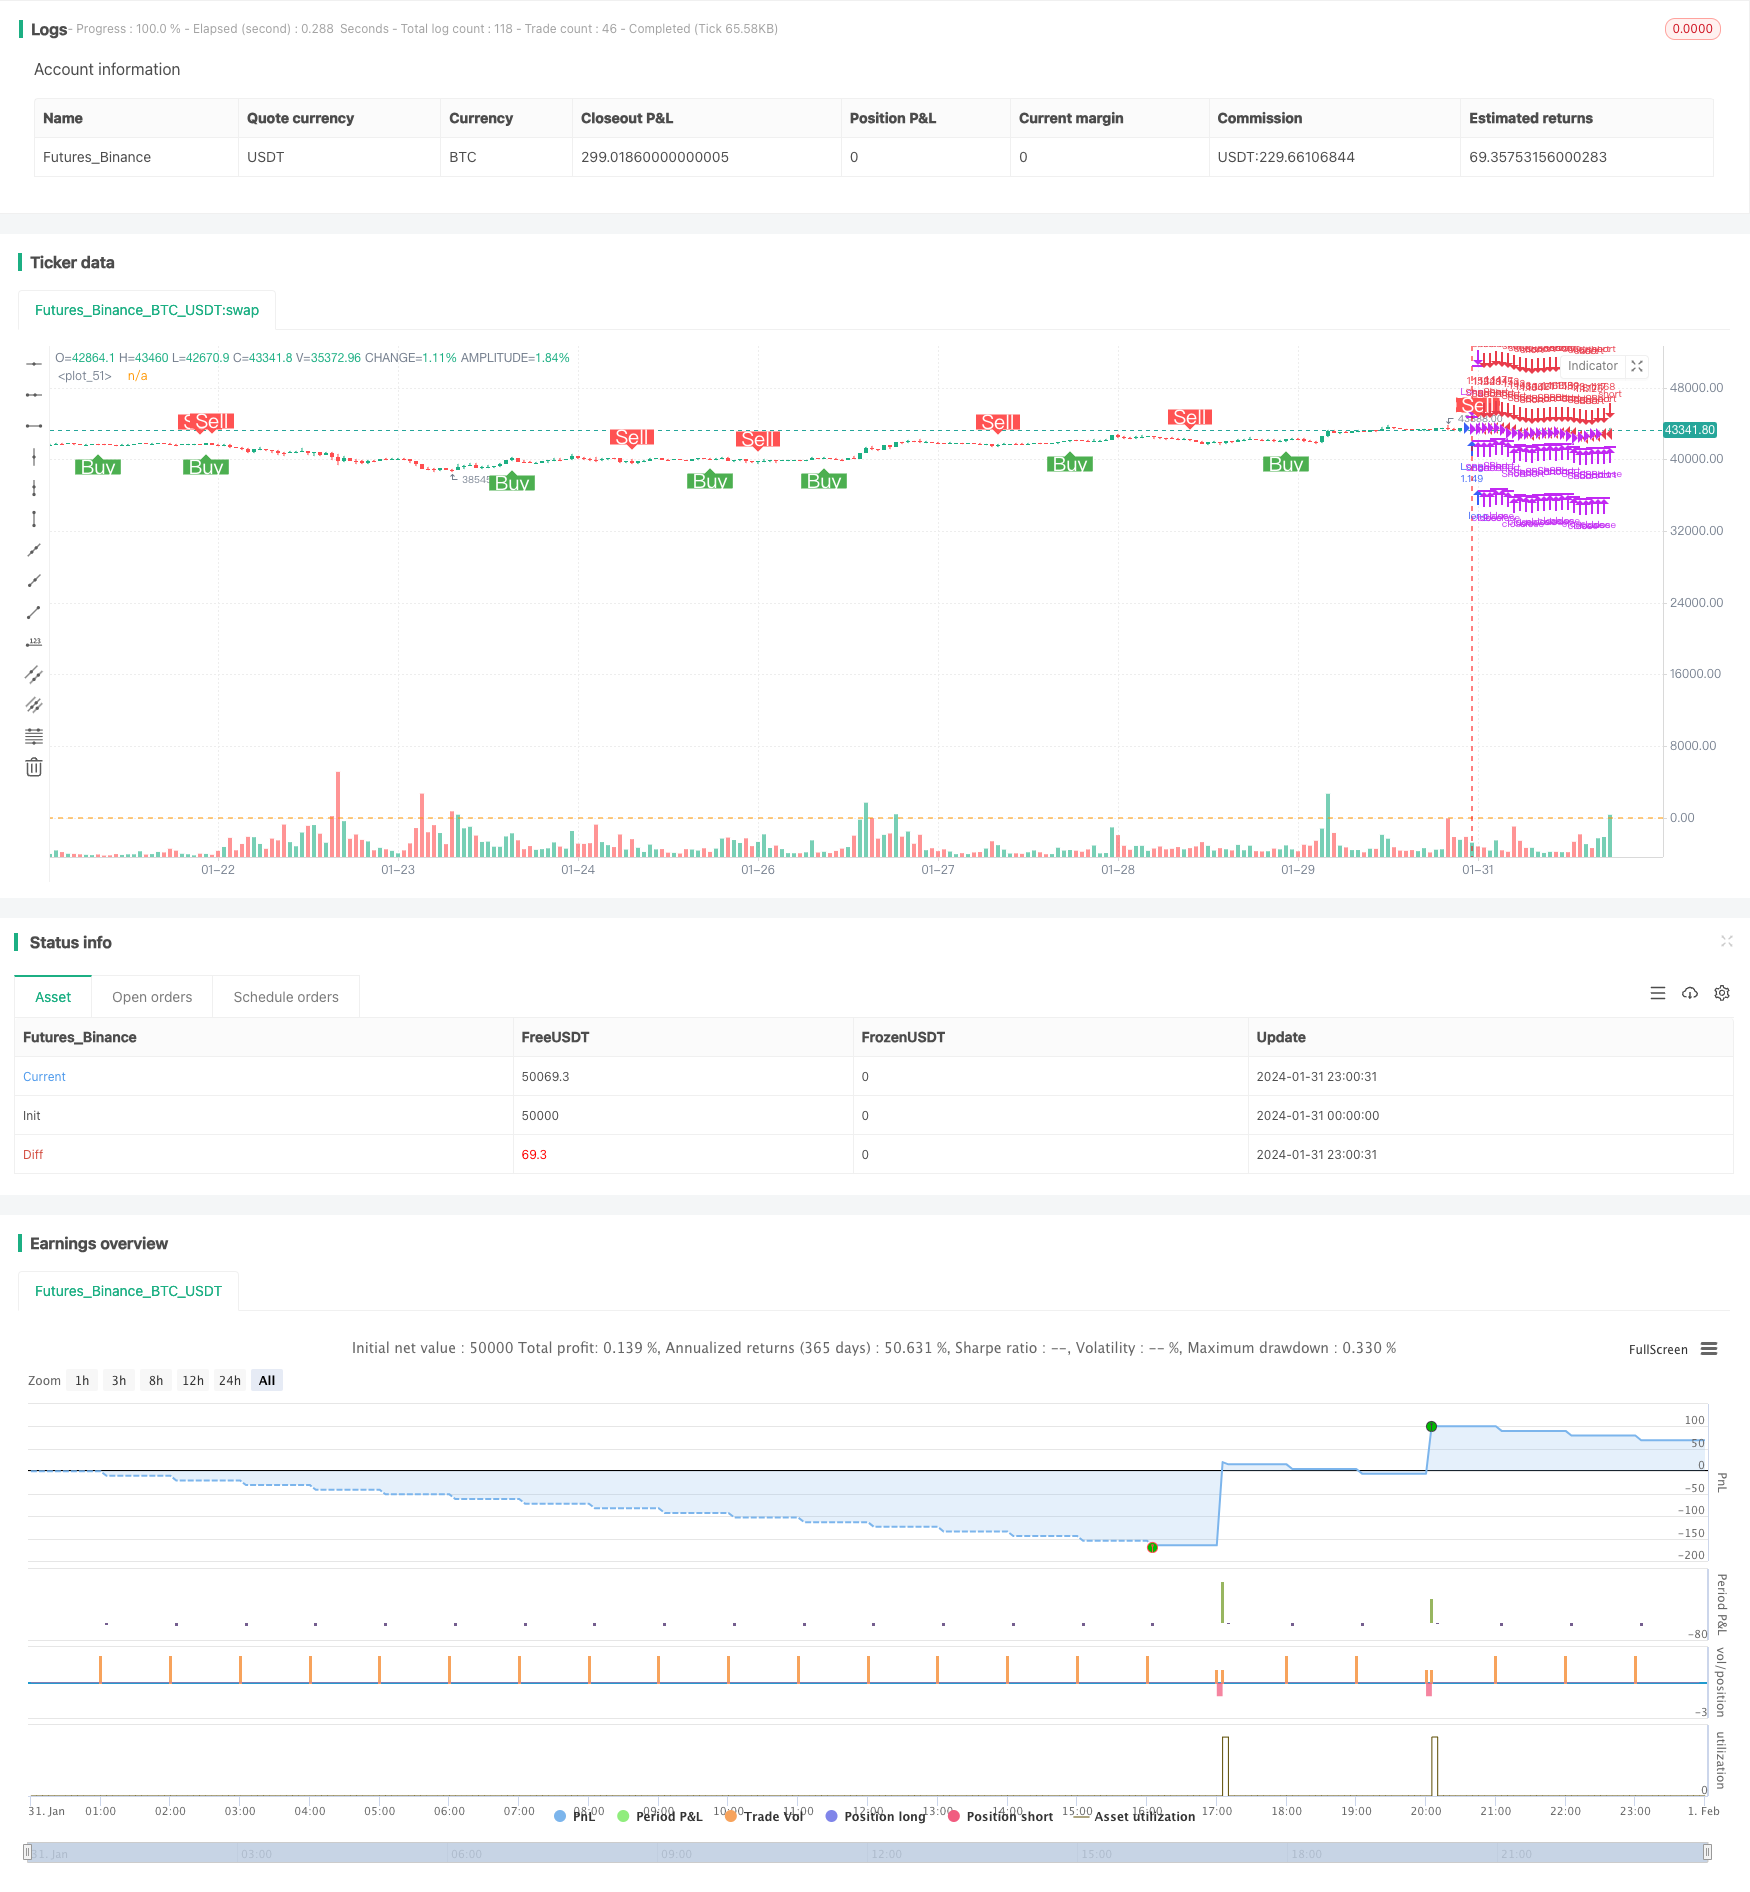
/*backtest
start: 2024-01-31 00:00:00
end: 2024-02-01 00:00:00
period: 1h
basePeriod: 15m
exchanges: [{"eid":"Futures_Binance","currency":"BTC_USDT"}]
*/

//@version=5
// This source code is subject to the terms of the Mozilla Public License 2.0 at https://mozilla.org/MPL/2.0/
// © mtahreemalam original strategy by LazyBear

strategy(title = 'SQM Strategy, TP & SL',
         shorttitle = 'Squeeze.M Strat',
         overlay = true,
         pyramiding = 0,
         default_qty_type = strategy.percent_of_equity,
         default_qty_value = 100,
         initial_capital = 1000,
         commission_type=strategy.commission.percent,
         commission_value=0.0,
         process_orders_on_close=true,
         use_bar_magnifier=true)
//Strategy logic
strategy_logic = input.string("Cross above 0", "Strategy Logic", options = ["LazyBear", "Cross above 0"])

// Date Range
testPeriodSwitch = input(false, "Custom Backtesting Date Range",group="Backtesting Date Range")
i_startTime = input(defval = timestamp("01 Jan 2022 00:01 +0000"), title = "Backtesting Start Time",group="Backtesting Date Range")
i_endTime = input(defval = timestamp("31 Dec 2022 23:59 +0000"), title = "Backtesting End Time",group="Backtesting Date Range")
timeCond = true
isPeriod = testPeriodSwitch == true ? timeCond : true

//// Stoploss and Take Profit Parameters
// Enable Long Strategy
enable_long_strategy = input.bool(true, title='Enable Long Strategy', group='SL/TP For Long Strategy', inline='1')
long_stoploss_value = input.float(defval=5, title='Stoploss %', minval=0.1, group='SL/TP For Long Strategy', inline='2')
long_stoploss_percentage = close * (long_stoploss_value / 100) / syminfo.mintick
long_takeprofit_value = input.float(defval=5, title='Take Profit %', minval=0.1, group='SL/TP For Long Strategy', inline='2')
long_takeprofit_percentage = close * (long_takeprofit_value / 100) / syminfo.mintick

// Enable Short Strategy
enable_short_strategy = input.bool(true, title='Enable Short Strategy', group='SL/TP For Short Strategy', inline='3')
short_stoploss_value = input.float(defval=5, title='Stoploss %', minval=0.1, group='SL/TP For Short Strategy', inline='4')
short_stoploss_percentage = close * (short_stoploss_value / 100) / syminfo.mintick
short_takeprofit_value = input.float(defval=5, title='Take Profit %', minval=0.1, group='SL/TP For Short Strategy', inline='4')
short_takeprofit_percentage = close * (short_takeprofit_value / 100) / syminfo.mintick

//// Inputs
//SQUEEZE MOMENTUM STRATEGY
length = input(20, title='BB Length', group = "Squeeze Momentum Settings")
mult = input(2.0, title='BB MultFactor', group = "Squeeze Momentum Settings")
source = close
lengthKC = input(20, title='KC Length', group = "Squeeze Momentum Settings")
multKC = input(1.5, title='KC MultFactor', group = "Squeeze Momentum Settings")
useTrueRange = input(true, title='Use TrueRange (KC)', group = "Squeeze Momentum Settings")
signalPeriod=input(5, title="Signal Length", group = "Squeeze Momentum Settings")
show_labels_sqm = input(title='Show Buy/Sell SQM Labels', defval=true, group = "Squeeze Momentum Settings")
h0 = hline(0)

// Defining MA
ma = ta.sma(source, length)

// Calculate BB
basis = ma
dev = mult * ta.stdev(source, length)
upperBB = basis + dev
lowerBB = basis - dev

// Calculate KC
range_1 = useTrueRange ? ta.tr : high - low
rangema = ta.sma(range_1, lengthKC)
upperKC = ma + rangema * multKC
lowerKC = ma - rangema * multKC


// SqzON | SqzOFF | noSqz
sqzOn = lowerBB > lowerKC and upperBB < upperKC
sqzOff = lowerBB < lowerKC and upperBB > upperKC
noSqz = sqzOn == false and sqzOff == false

// Momentum
val = ta.linreg(source - math.avg(math.avg(ta.highest(high, lengthKC), ta.lowest(low, lengthKC)), ta.sma(close, lengthKC)), lengthKC, 0)

red_line = ta.sma(val,signalPeriod)
blue_line = val

// lqm = if val > 0
//         if val > nz(val[1])
        // long_sqm_custom
        // if val < nz(val[1])
        // short_sqm_custom
// Plots
//plot(val, style = plot.style_line, title = "blue line", color= color.blue, linewidth=2)
//plot(ta.sma(val,SignalPeriod), style = plot.style_line, title = "red line",color = color.red, linewidth=2)

//plot(val, color=blue, linewidth=2)
//plot(0, color=color.gray, style=plot.style_cross, linewidth=2)
//plot(red_line, color=red, linewidth=2)

//LOGIC
//momentum filter
//filterMom = useMomAverage ? math.abs(val) > MomentumMin / 100000 ? true : false : true
//}

////SQM Long Short Conditions
//Lazy Bear Buy Sell Condition
// long_sqm_lazy = (blue_line>red_line)
// short_sqm_lazy = (blue_line<red_line)

long_sqm_lazy = ta.crossover(blue_line,red_line)
short_sqm_lazy = ta.crossunder(blue_line,red_line)


//Custom Buy Sell Condition
dir_sqm = val < 0 ? -1 : 1
long_sqm_custom = dir_sqm == 1 //and dir_sqm[1] == -1
short_sqm_custom = dir_sqm == -1 //and dir_sqm[1] == 1

long_sqm = strategy_logic == "LazyBear" ? long_sqm_lazy : long_sqm_custom
short_sqm = strategy_logic == "LazyBear" ? short_sqm_lazy : short_sqm_custom


// Plot Stoploss & Take Profit Levels
long_stoploss_price = strategy.position_avg_price * (1 - long_stoploss_value / 100)
long_takeprofit_price = strategy.position_avg_price * (1 + long_takeprofit_value / 100)
short_stoploss_price = strategy.position_avg_price * (1 + short_stoploss_value / 100)
short_takeprofit_price = strategy.position_avg_price * (1 - short_takeprofit_value / 100)
plot(enable_long_strategy and not enable_short_strategy ? long_stoploss_percentage : na, color=color.red, style=plot.style_linebr, linewidth=2, title='Long SL Level')
plot(enable_long_strategy and not enable_short_strategy ? long_takeprofit_percentage : na, color=color.green, style=plot.style_linebr, linewidth=2, title='Long TP Level')
plot(enable_short_strategy and not enable_long_strategy ? short_stoploss_price : na, color=color.red, style=plot.style_linebr, linewidth=2, title='Short SL Level')
plot(enable_short_strategy and not enable_long_strategy ? short_takeprofit_price : na, color=color.green, style=plot.style_linebr, linewidth=2, title='Short TP Level')


// Long Strategy
if long_sqm and enable_long_strategy == true
    strategy.entry('Long', strategy.long)
    strategy.exit('Long  SL/TP', from_entry='Long', loss=long_stoploss_percentage, profit=long_takeprofit_percentage)
    strategy.close('Long', comment = "L. CL")

// Short Strategy
if short_sqm and enable_short_strategy == true
    strategy.entry('Short', strategy.short)
    strategy.exit('Short SL/TP', from_entry='Short', loss=short_stoploss_percentage, profit=short_takeprofit_percentage)
    strategy.close('Short', comment = "S.Cl")

plot_sqm_long = long_sqm and not long_sqm[1]
plot_sqm_short = short_sqm and not short_sqm[1]

plotshape(plot_sqm_long and show_labels_sqm, title='Buy', style=shape.labelup, location=location.belowbar, size=size.normal, text='Buy', textcolor=color.new(color.white, 0), color=color.new(color.green, 0))
plotshape(plot_sqm_short and show_labels_sqm, title='Sell', style=shape.labeldown, location=location.abovebar, size=size.normal, text='Sell', textcolor=color.new(color.white, 0), color=color.new(color.red, 0))

// Date Range EXIT
if (not isPeriod)
    strategy.cancel_all()
    strategy.close_all()