Producteur de croissance - Tendance du double indice de croissance suivant une stratégie

Auteur:ChaoZhang est là., Date: 2023-11-15 17h31 et 24h
Les étiquettes:

img

Résumé

Il s'agit d'une stratégie de suivi de tendance double RSI qui utilise deux indicateurs RSI pour les signaux de trading longs et courts, combinés à un système de moyenne mobile pour déterminer la direction de la tendance.

Analyse des principes

La stratégie du double RSI utilise principalement deux indicateurs RSI avec des délais différents pour les signaux de trading. Elle définit d'abord deux paramètres RSI, un RSI de période plus longue comme indicateur principal, et un RSI de période plus courte comme filtre auxiliaire. Lorsque le RSI de période plus longue se déplace en dessous de la ligne de survente, un signal long est généré. Lorsque le RSI de période plus courte se déplace au-dessus de la ligne de surachat, un signal court est généré. Cela forme le double système de croisement RSI pour les opportunités de trading.

Pour filtrer les faux signaux, la stratégie intègre également des moyennes mobiles SMA et EMA pour la détection de tendance. Seulement lorsque la SMA de courte période traverse au-dessus de la EMA de longue période, le signal RSI long est considéré. Et seulement lorsque la SMA courte traverse au-dessous de la EMA longue, le signal RSI court est considéré. Cela garantit que les signaux RSI sont alignés sur la direction de la tendance et évitent de négocier contre la tendance.

En outre, la stratégie établit également une logique de stop loss et de take profit.

Analyse des avantages

La double stratégie algorithmique RSI présente les avantages suivants:

  1. Les indicateurs RSI à double échéancier peuvent déterminer plus précisément les signaux haussiers et baissiers.

  2. Le système de moyenne mobile aide à déterminer la direction de la tendance principale, évite les transactions contre la tendance et peut filtrer la plupart des transactions bruyantes, améliorant le taux de gain.

  3. Le mécanisme flexible de stop loss et de take profit permet des rendements plus élevés grâce à différents paramètres de take profit et gère le risque grâce à un stop loss.

  4. La logique de trading est simple et claire, facile à comprendre et à optimiser.
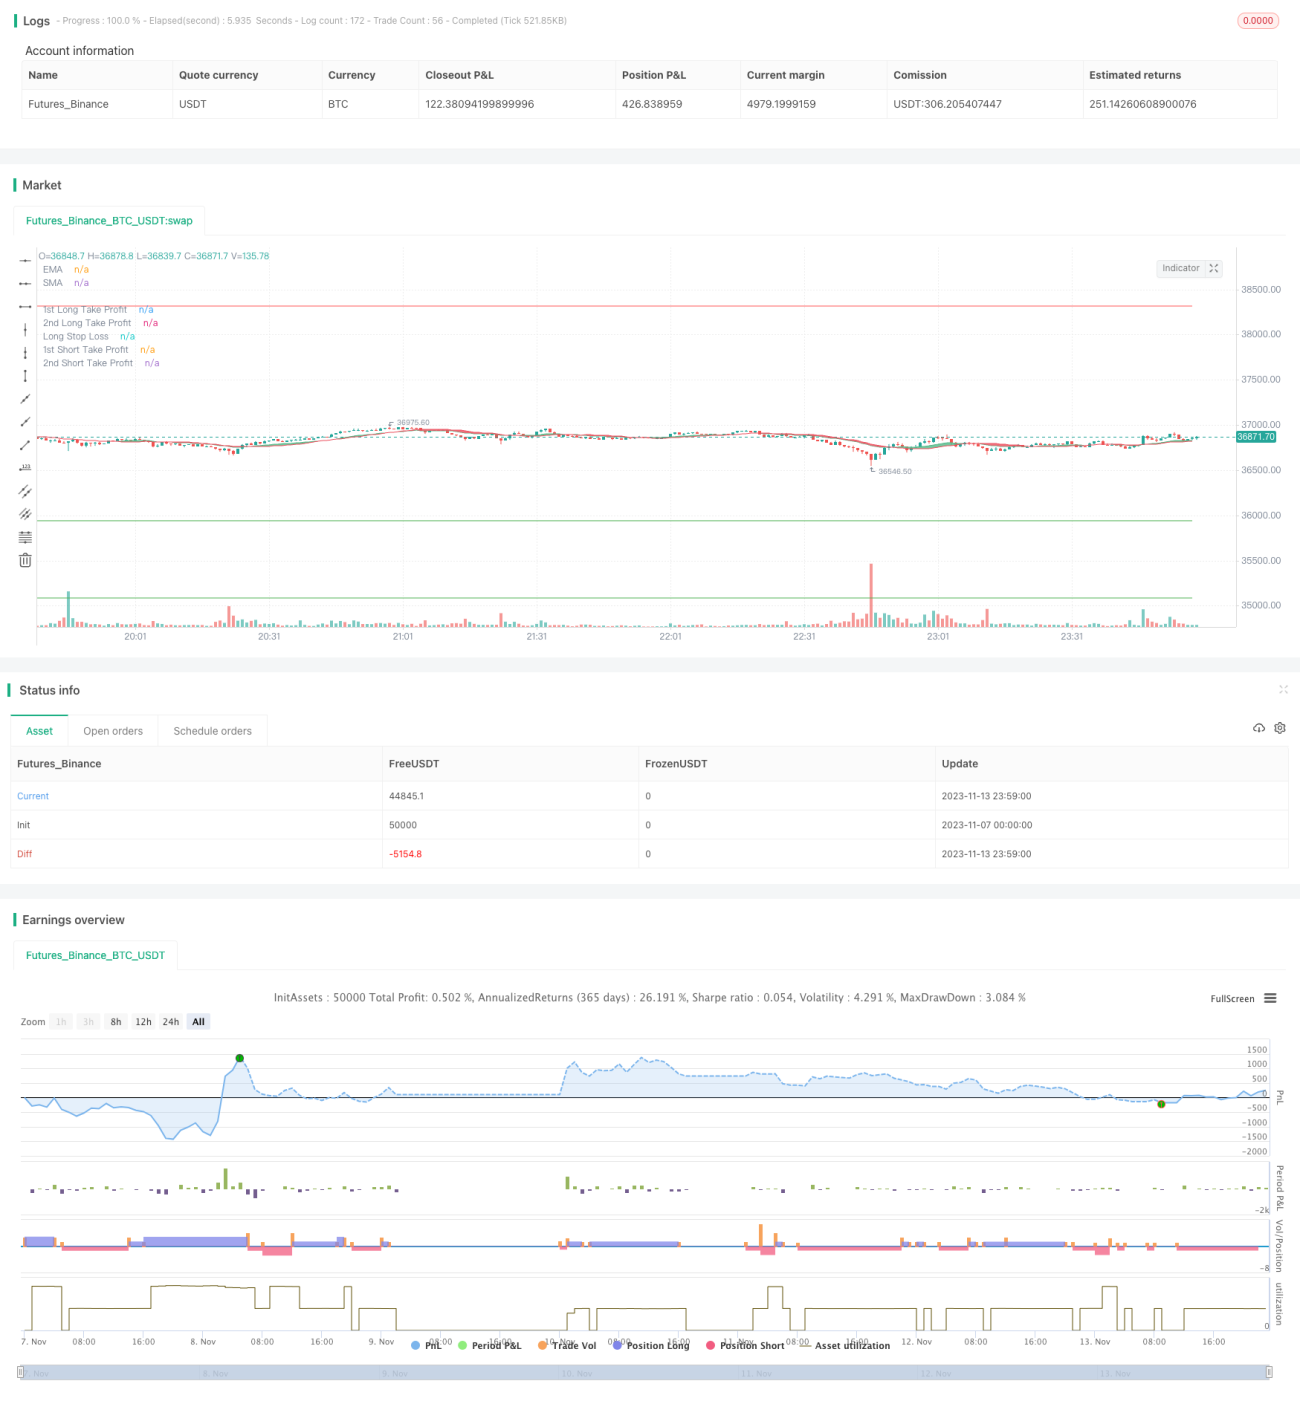
Analyse des risques

Malgré les avantages, la double stratégie RSI comporte également les risques suivants:

  1. L'indicateur RSI lui-même a une efficacité limitée dans les marchés variés et les renversements de tendance.

  2. Bien que les moyennes mobiles filtrent un faible bruit, elles sont moins efficaces pour détecter les changements de tendance des cycles intermédiaires et peuvent manquer les points tournants de la tendance.

  3. Les paramètres d'arrêt des pertes et de prise de bénéfices inappropriés peuvent entraîner des arrêts trop larges ou des bénéfices trop faibles, ce qui détériore les performances de la stratégie.

  4. Les positions longues et courtes peuvent entraîner des pertes accrues.

Pour faire face à ces risques, les paramètres peuvent être ajustés, des indicateurs de tendance et d'inversion plus avancés peuvent être introduits, la logique de stop et de profit optimisée et la taille des positions contrôlée pour minimiser les risques.

Directions d'optimisation

La double stratégie RSI peut être encore optimisée dans les aspects suivants:

  1. Testez différentes combinaisons de paramètres pour trouver les périodes optimales de RSI longues et courtes.

  2. Introduisez d'autres indicateurs comme le MACD pour une meilleure analyse des tendances et de l'inversion.

  3. Optimisez les stratégies de stop loss et de take profit, utilisez des stops de trailing ou déplacez des profits pour plus de flexibilité.

  4. Ajouter un module de commande de dimensionnement des positions pour ajuster les positions longues/courtes à différentes étapes du cycle de tendance.

  5. Incorporer des modèles d'apprentissage automatique pour améliorer la précision d'entrée et de sortie.

  6. Tests antérieurs sur différents produits et délais d'optimisation.

Conclusion

En résumé, la stratégie du double RSI est une stratégie typique de suivi de tendance. Son idée de combiner les signaux du double RSI et le filtrage du bruit moyen mobile est très classique et pratique. Bien qu'il existe des domaines à améliorer, la logique globale est claire et facile à comprendre et à optimiser.


/*backtest
start: 2023-11-07 00:00:00
end: 2023-11-14 00:00:00
period: 1m
basePeriod: 1m
exchanges: [{"eid":"Futures_Binance","currency":"BTC_USDT"}]
*/

//@version=4
strategy("Growth Producer", overlay=true, initial_capital = 1000, currency = "USD", pyramiding = 2, commission_type=strategy.commission.percent, commission_value=0.07, default_qty_type = strategy.percent_of_equity, default_qty_value = 100)

//Functions
Atr(p) =>
    atr = 0.
    Tr = max(high - low, max(abs(high - close[1]), abs(low - close[1])))
    atr := nz(atr[1] + (Tr - atr[1])/p,Tr)

/// TREND
ribbon_period = input(19, "Period", step=1)

leadLine1 = ema(close, ribbon_period)
leadLine2 = sma(close, ribbon_period)

p1 = plot(leadLine1, color= #53b987, title="EMA", transp = 50, linewidth = 1)
p2 = plot(leadLine2, color= #eb4d5c, title="SMA", transp = 50, linewidth = 1)
fill(p1, p2, transp = 60, color = leadLine1 > leadLine2 ? #53b987 : #eb4d5c)

// Relative volatility index
length = input(120,"RVI period", minval=1), src = close
len = 14
stddev = stdev(src, length)
upper = ema(change(src) <= 0 ? 0 : stddev, len)
lower = ema(change(src) > 0 ? 0 : stddev, len)
rvi = upper / (upper + lower) * 100
benchmark = input(35, "RVI benchmark", minval=10, maxval=100, step=0.1)

// Plot RVI
// h0 = hline(80, "Upper Band", color=#C0C0C0)
// h1 = hline(20, "Lower Band", color=#C0C0C0)
// fill(h0, h1, color=#996A15, title="Background")
// offset = input(0, "Offset", type = input.integer, minval = -500, maxval = 500)
// plot(rvi, title="RVI", color=#008000, offset = offset)


/// MFI input
mfi_source = hlc3
mfi_length = input(19, "MFI Length", minval=1)
mfi_lower = input(15, "MFI Lower level", minval=0, maxval=50)
mfi_upper = input(90, "MFI Higher level", minval=50, maxval=100)


// MFI
upper_s = sum(volume * (change(mfi_source) <= 0 ? 0 : mfi_source), mfi_length)
lower_s = sum(volume * (change(mfi_source) >= 0 ? 0 : mfi_source), mfi_length)
mf = rsi(upper_s, lower_s)
// mfp = plot(mf, color=color.new(color.gray,0), linewidth=1)
// top = hline(mfi_upper, color=color.new(color.gray, 100), linewidth=1, editable=false)
// bottom = hline(mfi_lower, color=color.new(color.gray,100), linewidth=1, editable=false)
// hline(0, color=color.new(color.black,100), editable=false)
// hline(100, color=color.new(color.black,100), editable=false)

// Breaches
// b_color = (mf > mfi_upper) ? color.new(color.red,70) : (mf < mfi_lower) ? color.new(color.green,60) : na
// bgcolor(HighlightBreaches ? b_color : na)

// fill(top, bottom, color=color.gray, transp=75)

// Initial inputs
Act_RSI_VWAP_long = input(true, "RSI VOLUME WEIGHTED AVERAGE PRICE LONG")
RSI_VWAP_length_long = input(16, "RSI-VWAP LENGTH LONG")
RSI_VWAP_overSold_long = input(13, "RSI-VWAP OVERSOLD LONG", type=input.float)
RSI_VWAP_overBought_long = input(68, "RSI-VWAP OVERBOUGHT LONG", type=input.float)

Act_RSI_VWAP_short = input(true, "RSI VOLUME WEIGHTED AVERAGE PRICE SHORT")
RSI_VWAP_length_short = input(14, "RSI-VWAP LENGTH SHORT")
RSI_VWAP_overSold_short = input(7, "RSI-VWAP OVERSOLD SHORT", type=input.float)
RSI_VWAP_overBought_short = input(68, "RSI-VWAP OVERBOUGHT SHORT", type=input.float)

// RSI with VWAP as source
RSI_VWAP_long = rsi(vwap(close), RSI_VWAP_length_long)
RSI_VWAP_short = rsi(vwap(close), RSI_VWAP_length_short)

// Plot Them Separately.
// Plotting LONG, Put overlay=false
// r=plot(RSI_VWAP_long, color = RSI_VWAP_long > RSI_VWAP_overBought_long ? color.red : RSI_VWAP_lnog < RSI_VWAP_overSold_long ? color.lime : color.blue, title="rsi", linewidth=2, style=plot.style_line)
// h1=plot(RSI_VWAP_overBought_long, color = color.gray, style=plot.style_stepline)
// h2=plot(RSI_VWAP_overSold_long, color = color.gray, style=plot.style_stepline)
// fill(r,h1, color = RSI_VWAP_long > RSI_VWAP_overBought_long ? color.red : na, transp = 60)
// fill(r,h2, color = RSI_VWAP_long < RSI_VWAP_overSold_long ? color.lime : na, transp = 60)

// Plotting SHORT, Put overlay=false
// r=plot(RSI_VWAP_short, color = RSI_VWAP_short > RSI_VWAP_overBought_short ? color.red : RSI_VWAP_short < RSI_VWAP_overSold_short ? color.lime : color.blue, title="rsi", linewidth=2, style=plot.style_line)
// h1=plot(RSI_VWAP_overBought_short, color = color.gray, style=plot.style_stepline)
// h2=plot(RSI_VWAP_overSold_short, color = color.gray, style=plot.style_stepline)
// fill(r,h1, color = RSI_VWAP_short > RSI_VWAP_overBought_short ? color.red : na, transp = 60)
// fill(r,h2, color = RSI_VWAP_short < RSI_VWAP_overSold_short ? color.lime : na, transp = 60)


///////  STRATEGY Take Profit / Stop Loss ////////
////// LONG //////

long_tp1_inp = input(3.3, title='Long Take Profit 1 %', step=0.1)/100
long_tp1_qty = input(15, title="Long Take Profit 1 Qty", step=1)

long_tp2_inp = input(12, title='Long Take Profit 2%', step=0.1)/100
long_tp2_qty = input(100, title="Long Take Profit 2 Qty", step=1)

long_sl_inp = input(3.3, title='Long Stop Loss %', step=0.1)/100

long_take_level_1 = strategy.position_avg_price * (1 + long_tp1_inp)
long_take_level_2 = strategy.position_avg_price * (1 + long_tp2_inp)
long_stop_level = strategy.position_avg_price * (1 - long_sl_inp)

////// SHORT //////
short_tp1_inp = input(3.2, title='Short Take Profit 1 %', step=0.1)/100
short_tp1_qty = input(20, title="Short Take Profit 1 Qty", step=1)

short_tp2_inp = input(5.5, title='Short Take Profit 2%', step=0.1)/100
short_tp2_qty = input(100, title="Short Take Profit 2 Qty", step=1)

short_sl_inp = input(3.2, title='Short Stop Loss %', step=0.1)/100

short_take_level_1 = strategy.position_avg_price * (1 - short_tp1_inp)
short_take_level_2 = strategy.position_avg_price * (1 - short_tp2_inp)
short_stop_level = strategy.position_avg_price * (1 + short_sl_inp)


///Strategy_Conditions
/// LONG ///
entry_long =(crossover(RSI_VWAP_long, RSI_VWAP_overSold_long) and leadLine2<leadLine1) or (crossunder(mf,mfi_lower) and leadLine2<leadLine1)
entry_price_long=valuewhen(entry_long,close,0)
exit_long =crossunder(RSI_VWAP_long, RSI_VWAP_overBought_long)

/// SHORT ///

entry_short =crossunder(RSI_VWAP_short, RSI_VWAP_overBought_short) and leadLine2>leadLine1 or (crossover(mf,mfi_upper) and leadLine2>leadLine1)
entry_price_short=valuewhen(entry_short,close,0)
exit_short =crossover(RSI_VWAP_short, RSI_VWAP_overSold_short)

////// BACKTEST PERIOD ///////
testStartYear = input(2019, "Backtest Start Year")
testStartMonth = input(1, "Backtest Start Month")
testStartDay = input(1, "Backtest Start Day")
testPeriodStart = timestamp(testStartYear,testStartMonth,testStartDay,0,0)

testStopYear = input(2020, "Backtest Stop Year")
testStopMonth = input(12, "Backtest Stop Month")
testStopDay = input(31, "Backtest Stop Day")
testPeriodStop = timestamp(testStopYear,testStopMonth,testStopDay,0,0)

testPeriod() => true

if testPeriod()

    if strategy.position_size == 0 or strategy.position_size > 0 and rvi>benchmark
        strategy.entry("long", true, when = entry_long, comment="Insert Enter Long Comment")
    strategy.exit("TP1","long", qty_percent=long_tp1_qty, limit=long_take_level_1, stop=long_stop_level)
    strategy.exit("TP2","long", qty_percent=long_tp2_qty, limit=long_take_level_2, stop=long_stop_level)
    strategy.close("long", when=exit_long, comment = "Insert Exit Long Comment")

    if strategy.position_size == 0 or strategy.position_size < 0 and rvi>benchmark
        strategy.entry("short", false, when = entry_short, comment="Insert Enter Short Comment")
    strategy.exit("TP1","short", qty_percent=short_tp1_qty, limit=short_take_level_1, stop=short_stop_level)
    strategy.exit("TP2","short", qty_percent=short_tp2_qty, limit=short_take_level_2, stop=short_stop_level)
    strategy.close("short", when=exit_short, comment = "Insert Exit Short Comment")


// LONG POSITION
plot(strategy.position_size > 0 ? long_take_level_1 : na, style=plot.style_linebr, color=color.green, linewidth=1, title="1st Long Take Profit")
plot(strategy.position_size > 0 ? long_take_level_2 : na, style=plot.style_linebr, color=color.green, linewidth=1, title="2nd Long Take Profit")
plot(strategy.position_size > 0 ? long_stop_level : na, style=plot.style_linebr, color=color.red, linewidth=1, title="Long Stop Loss")


// SHORT POSITION
plot(strategy.position_size < 0 ? short_take_level_1 : na, style=plot.style_linebr, color=color.green, linewidth=1, title="1st Short Take Profit")
plot(strategy.position_size < 0 ? short_take_level_2 : na, style=plot.style_linebr, color=color.green, linewidth=1, title="2nd Short Take Profit")
plot(strategy.position_size < 0 ? short_stop_level : na, style=plot.style_linebr, color=color.red, linewidth=1, title="Long Stop Loss")

Plus de