Stratégie de la super tendance qui engloutit la bombe

Aperçu
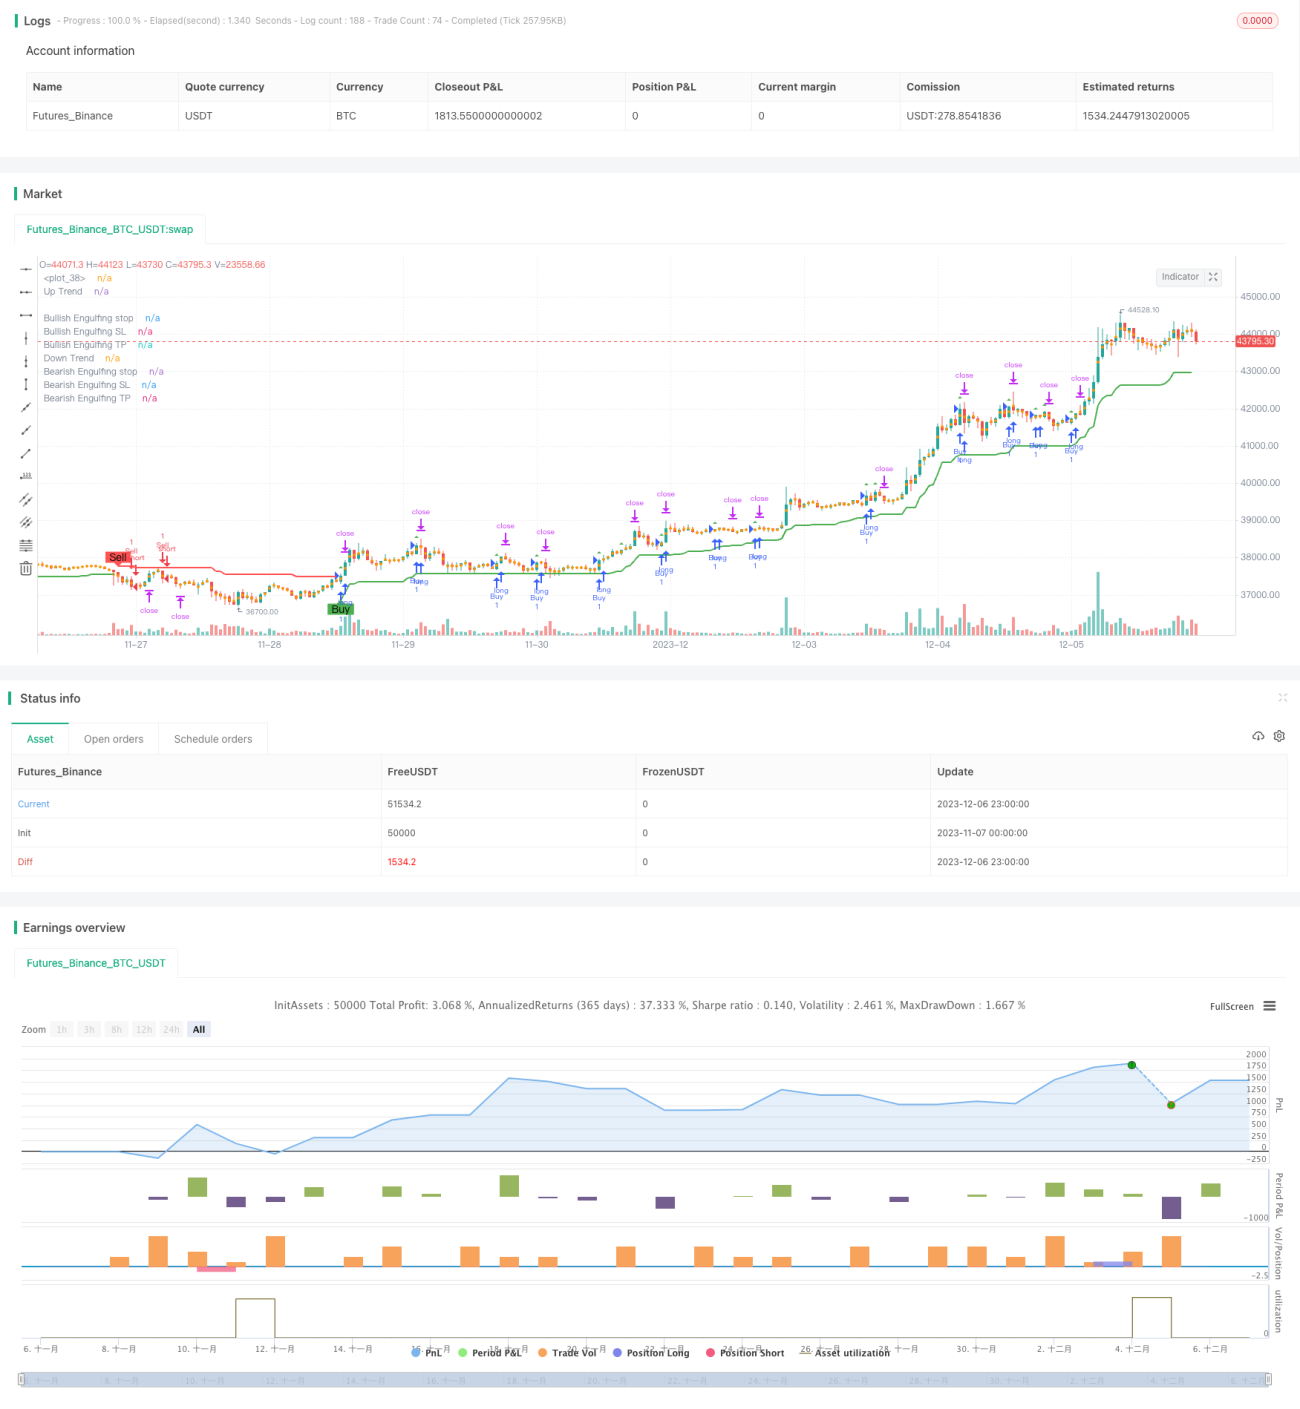
La stratégie de détrimentation est une stratégie de suivi de la tendance qui combine l'amplitude moyenne réelle (ATR), l'indicateur de détrimentation et la forme de détrimentation pour identifier la direction de la tendance et trouver des opportunités d'entrée à taux avantageux tout en confirmant la forme de détrimentation.
Principe de stratégie
La stratégie utilise d'abord l'ATR et l'indicateur de tendance supérieure pour déterminer la direction de la tendance du marché CURRENT. Plus précisément, elle est définie comme tendance à la baisse lorsque le prix est inférieur à la trajectoire ascendante et comme tendance à la hausse lorsque le prix est supérieur à la trajectoire descendante.
Dans une tendance à la hausse, la stratégie déclenche une multiplication de coups lorsque la ligne K précédente se termine à un prix supérieur au prix d'ouverture de la ligne K actuelle et que la ligne K actuelle se termine à un prix inférieur au prix d'ouverture. Dans une tendance baissière, la coupe de la ligne K précédente se termine à un prix inférieur au prix d'ouverture de la ligne K actuelle et que la ligne K actuelle se termine à un prix supérieur au prix d'ouverture.
Un signal de transaction est généré lorsque la forme de l'absorption correspond à la direction de la tendance. De plus, la stratégie calcule le prix d'arrêt et le prix d'arrêt en fonction de la forme de l'absorption. Après l'entrée, si le prix touche le prix d'arrêt ou d'arrêt, il sort de la position actuelle.
Analyse des avantages
Cette stratégie, combinant les avantages du suivi des tendances et de la reconnaissance des formes, permet d'identifier les signaux de retournement dans les tendances, afin de capturer les tendances les plus importantes aux points de basculement du marché. En outre, le mécanisme de stop-loss permet également de contrôler efficacement le risque de perte.
Analyse des risques
Le plus grand risque de cette stratégie est que la forme de l'engloutissement peut être fausse, ce qui génère de faux signaux. En outre, les paramètres de stop-loss et d'arrêt peuvent également être trop arbitraires pour atteindre l'équilibre des pertes et des gains. Il est recommandé d'optimiser la combinaison de paramètres et d'ajuster correctement la position des stop-loss.
Direction d'optimisation
On peut envisager d'optimiser les paramètres de l'ATR en temps réel afin de mieux capturer les variations de la volatilité du marché. En outre, d'autres indicateurs peuvent être étudiés pour identifier les tendances et améliorer encore la stabilité de la stratégie.
Résumer
La stratégie d'absorption de la surtrend, qui intègre les avantages du suivi de la tendance et de la reconnaissance de la forme, est plus efficace aux points de retournement du marché. Cependant, la stratégie présente également un certain risque de faux signaux qui nécessite un test et une optimisation supplémentaires pour contrôler le risque.
- 1