Stratégie de suivi des tendances croisées MA dynamiques

Aperçu
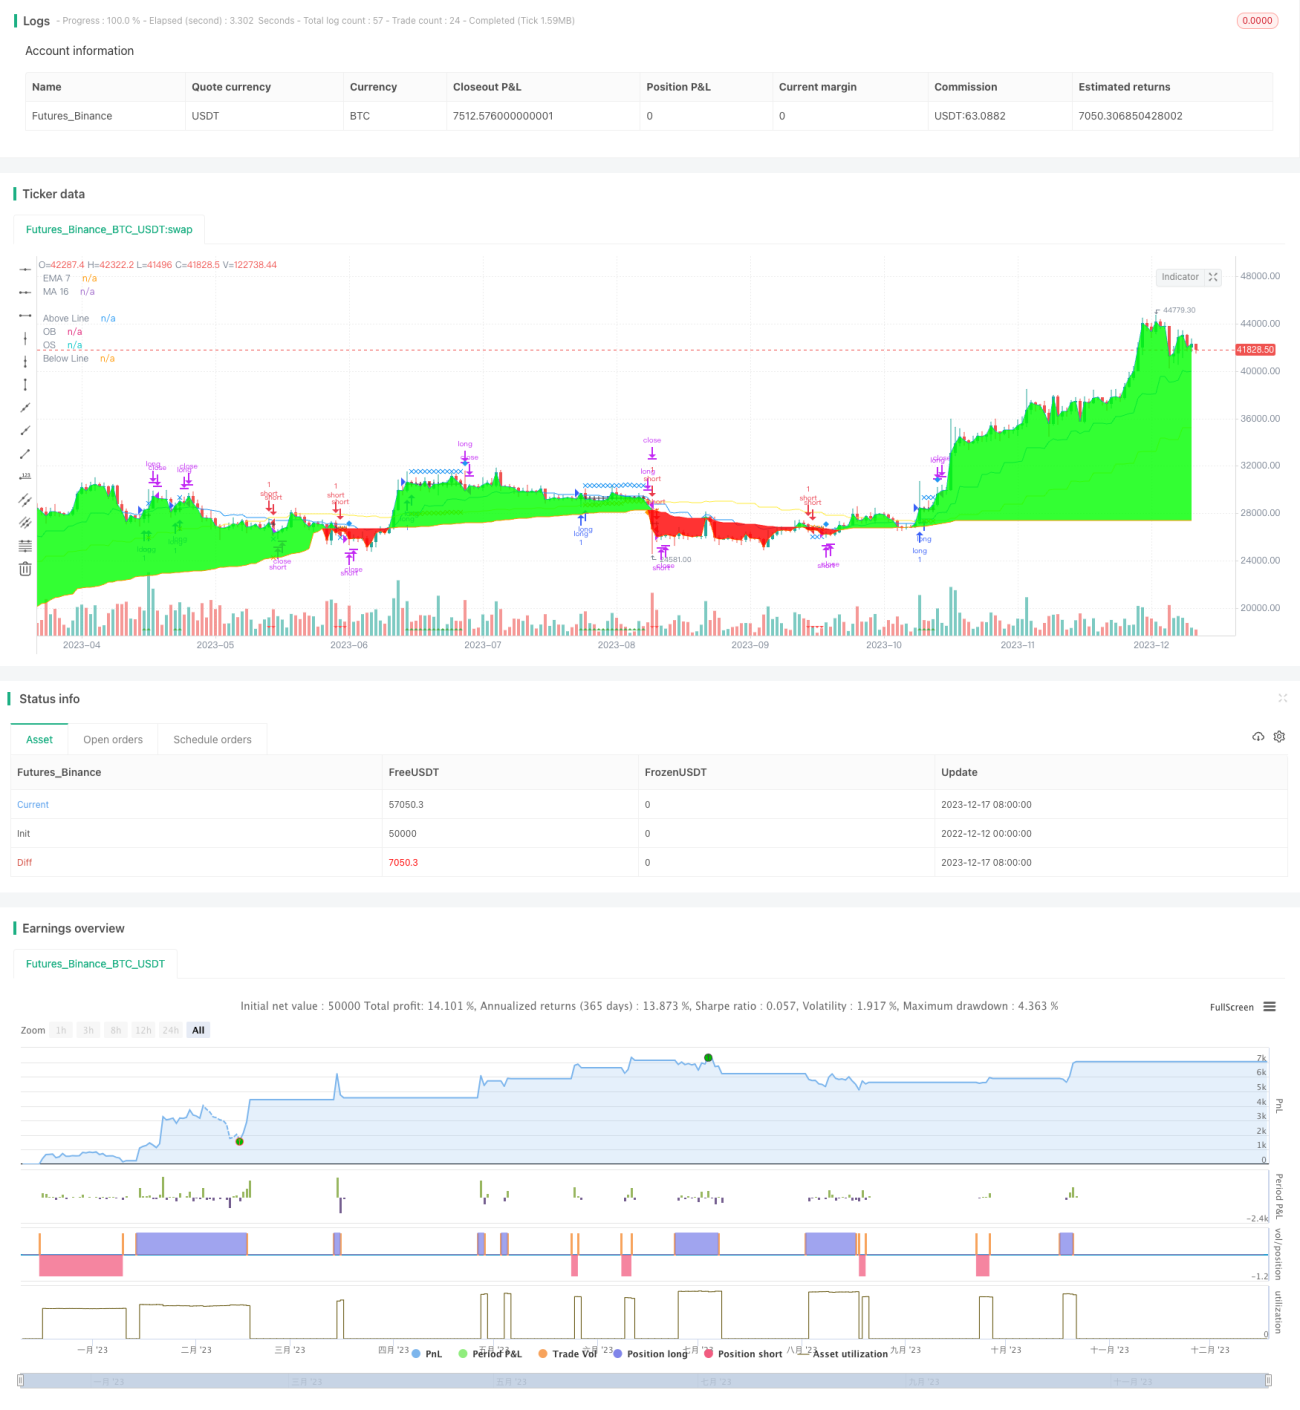
Cette stratégie est basée sur la croisée des bandes de support de résistance dynamique et de la ligne moyenne de MA comme signal d'entrée, en utilisant un arrêt de suivi de tendance pour réaliser un profit de suivi de longue ligne.
Principe de stratégie
-
Les points de résistance et de soutien dynamiques sont calculés à l'aide d'une méthode statistique en pourcentage pour construire les zones de retournement possibles.
-
Lorsque le prix entre dans la zone de retournement, il décide de franchir la courbe rapide de la MA ou la courbe lente de la MA, générant un signal de transaction.
-
Après l'entrée, lancez le mécanisme de suivi des pertes, bloquez les bénéfices avec un arrêt dynamique et suivez la tendance des bénéfices.
-
Lorsque le prix déclenche un stop loss ou un stop position, la position est levée.
Analyse des avantages
-
Le support de résistance dynamique permet d'identifier les zones de retournement possibles et d'améliorer la précision d'entrée.
-
La moyenne de la MA est croisée avec le canal de pourcentage pour éviter les fausses signaux.
-
La méthode de suivi des pertes permet de bloquer efficacement les bénéfices et de prévenir l'expansion des retraits.
-
Il est possible de configurer plusieurs paramètres pour s'adapter à différents environnements de marché.
Analyse des risques
-
Il y a un risque de faux signaux dans une tendance non tendancielle.
-
Une mauvaise configuration des paramètres peut entraîner une entrée excessive dans le champ et devrait être assouplie de manière appropriée.
-
Les données de rétroaction doivent couvrir un cycle de fonctionnement adéquat et éviter les limitations.
-
Pendant le processus de disque dur, il est recommandé d'augmenter la marge d'arrêt de manière appropriée pour éviter les sauts en l'air.
Direction d'optimisation
-
Test de l'effet combiné de différents paramètres du cycle MA.
-
Ajustez les paramètres de support de résistance dynamique pour optimiser l'effet de reconnaissance de retournement.
-
Évaluer l'impact des différents paramètres de suivi des pertes sur la courbe de rendement de la stratégie.
-
Pour améliorer la stabilité, essayez de combiner les signaux de filtrage avec d'autres indicateurs.
Résumer
L'idée générale de cette stratégie est claire. L'utilisation de la bande de support de résistance dynamique pour identifier les zones susceptibles de se retourner en tant que filtre de signal, et l'utilisation de la direction de la tendance pour déterminer la direction de la tendance pour générer des signaux de négociation, le suivi de l'arrêt des pertes pour contrôler efficacement les risques, l'amélioration continue de l'efficacité de la stratégie grâce à l'optimisation des paramètres.
- 1