Stratégie de suivi de tendance à canal oscillant sur plusieurs périodes
[trans]
Aperçu
La stratégie est basée sur un indicateur de super-tendance, combiné à une analyse des tendances du marché sur plusieurs périodes de temps, et utilise une méthode de chambres de choc pour identifier les moments d’entrée.
Principe de stratégie
- L’utilisation d’indicateurs traditionnels de super-tendance pour déterminer la direction de la tendance
- Augmentation de la tendance des super-cadres à haute température pour s’assurer que les cadres à haute température ont aussi une tendance
- Déterminez la direction de la tendance globale en fonction de deux indicateurs de tendance superposés sur deux périodes
- Déterminer le moment d’entrée en fonction de la montée et de la baisse de la trajectoire de rupture de la chaîne de choc
Analyse des avantages
- Une analyse de plusieurs périodes permet de mieux évaluer les tendances
- Une combinaison de cadres à haut et à bas niveau garantit à la fois les grandes tendances et les opportunités à court terme.
- Les voies de choc définissent des points d’arrêt pour contrôler les risques
Risques et solutions
- Les super tendances ont un certain retard en elles-mêmes et peuvent manquer un point de basculement.
- La conversion de tendance est apprise par l’optimisation des paramètres ou en combinaison avec d’autres indicateurs, ce qui réduit le risque de retard
Direction d’optimisation
- Optimiser les paramètres de super-tendance pour réduire le retard
- Augmentation des filtres de tendance pour une meilleure compréhension des tendances à la hausse
- Test et sélection de la méthode de prévention la plus appropriée
Résumer
La stratégie intègre l’analyse de plusieurs périodes et des indicateurs de suivi des tendances, pour maîtriser les principales tendances tout en recherchant des moments d’entrée spécifiques. Grâce à une optimisation continue, il est possible d’obtenir des gains supplémentaires stables à long terme.
||
Overview
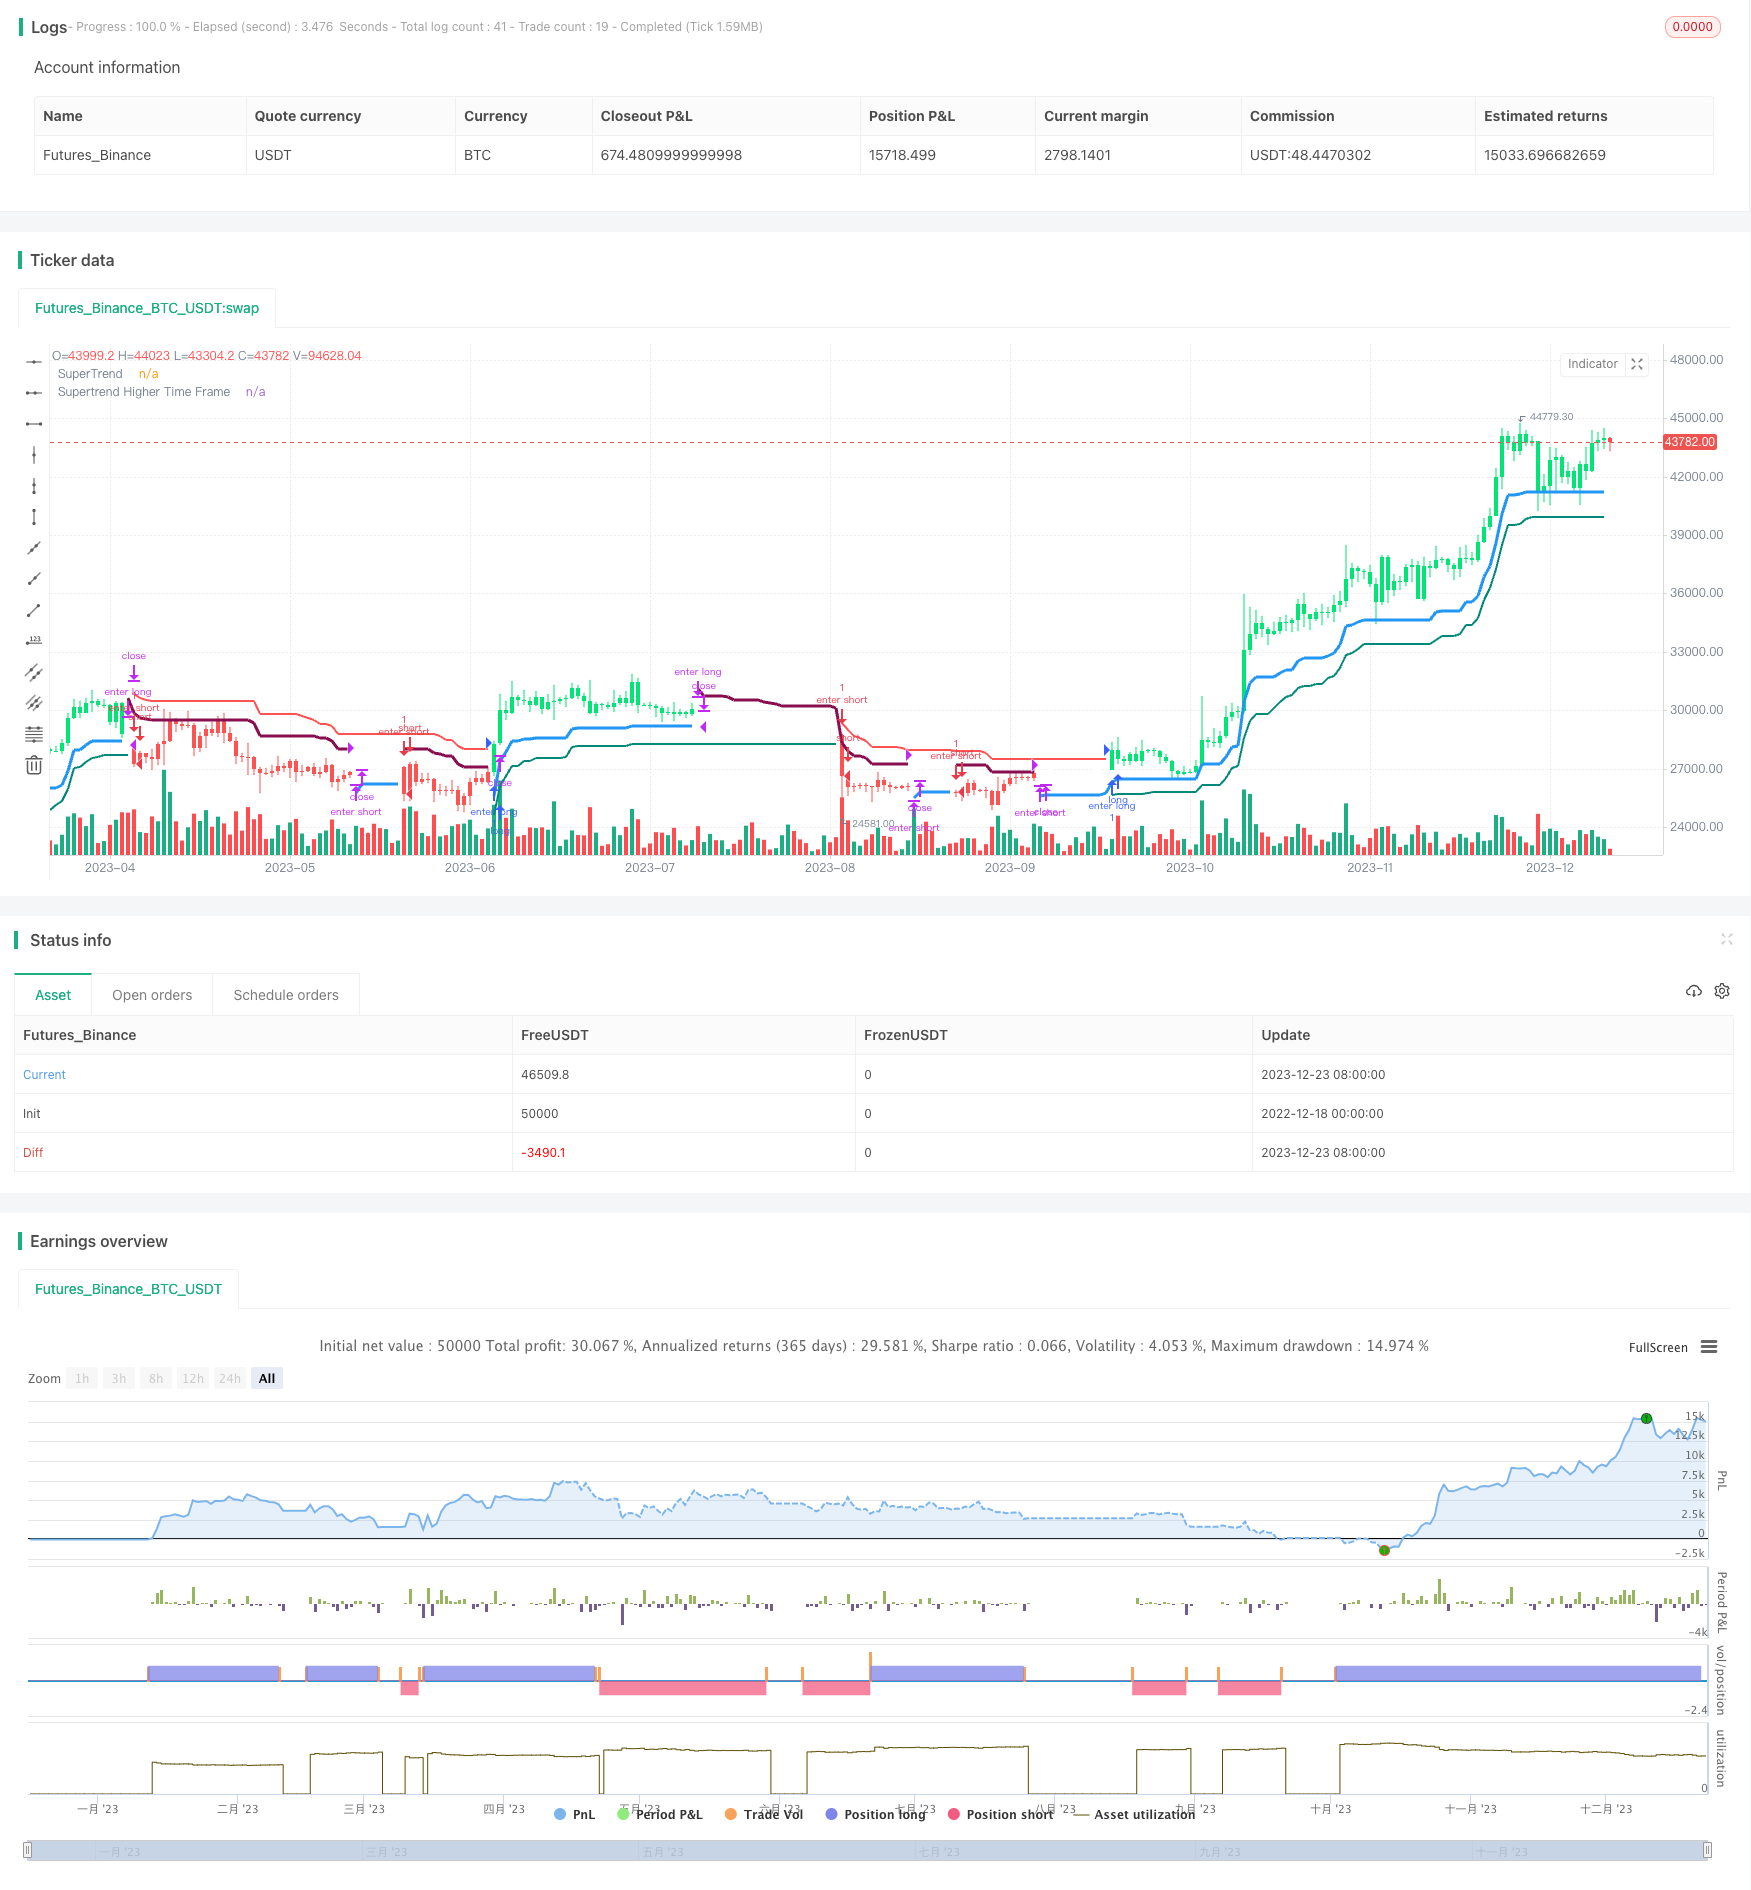
This strategy is based on the Supertrend indicator, combined with multiple timeframe market trend analysis, and adopts the oscillation channel method to identify entry opportunities.
Strategy Principle
- Use the traditional Supertrend indicator to determine the trend direction
- Add Supertrend of higher timeframe to ensure there is a trend in higher timeframe too
- Determine the overall trend direction based on the Supertrend indicators of two timeframes
- Identify specific entry opportunities based on the price breakout of the upper and lower rails of the oscillation channel
Advantage Analysis
- Multi-timeframe analysis makes trend judgment more reliable
- Combining high and low timeframes ensures catching the major trend while being able to capture short-term opportunities
- The oscillation channel setting stops loss points which helps risk control
Risks and Solutions
- The Supertrend itself has some lagging phenomenon, which may miss trend reversal points
- The lagging risk can be reduced by optimizing parameters or incorporating other indicators to assist in identifying trend changes
Optimization Directions
- Optimize Supertrend parameters to reduce lagging
- Add trend filtering indicators to ensure catching the major trend more accurately
- Test and select more appropriate stop loss methods
Summary
This strategy integrates multi-timeframe analysis and trend tracking indicators to grasp the major trend while seeking specific entry opportunities. With continuous optimization, it is expected to achieve long-term steady excess returns.
/*backtest
start: 2022-12-18 00:00:00
end: 2023-12-24 00:00:00
period: 1d
basePeriod: 1h
exchanges: [{"eid":"Futures_Binance","currency":"BTC_USDT"}]
*/

// This source code is subject to the terms of the Mozilla Public License 2.0 at https://mozilla.org/MPL/2.0/
// © ramki_simple
// Thanks to LonesomeTheBlue for the original code
//@version=4
strategy("Multi Supertrend with no-repaint HTF option strategy", overlay = true, shorttitle='Multi Supertrend')
//auto higher time frame
HTFAuto = timeframe.period == '1' ? '5' :
  timeframe.period == '3' ? '15' :
  timeframe.period == '5' ? '15' :
  timeframe.period == '15' ? '60' :
  timeframe.period == '30' ? '60' :
  timeframe.period == '45' ? '60' :
  timeframe.period == '60' ? '240' :
  timeframe.period == '120' ? '240' :
  timeframe.period == '180' ? '240' :
  timeframe.period == '240' ? 'D' :
  timeframe.period == 'D' ? 'W' :
  '5W'
HTFSelection = input(title='Select HTF Automatically for Additional Supertrend', type=input.bool, defval=false)
HTFUserSel = input(title='Select Higher Timeframe for Additional Supertrend',type=input.resolution, defval ='')
HTF = HTFSelection ? HTFAuto : HTFUserSel


Mult1 = input(title='Multiplier for Default Supertrend', defval=3.0, minval = 0, maxval = 10)
Period1 = input(title='Period for Default Supertrend', defval=10, minval = 1, maxval = 100)
Mult2 = input(title='Multiplier for Additional Supertrend', defval=2.0, minval = 0, maxval = 10)
Period2 = input(title='Period for Additional Supertrend', defval=14, minval = 1, maxval = 100)

chbarcol = input(true, title = "Change Bar Color")

[Trailings, Trend] = supertrend(Mult1, Period1)

linecolor = Trend == -1 and Trend[1] == -1 ? color.teal :
   Trend == 1 and Trend[1] == 1 ? color.red :
   color.new(color.white, 100)
plot(Trailings, color = linecolor,  linewidth = 2,title = "SuperTrend")

f_Security(_symbol, _res, _src) => security(_symbol, _res, _src[1], lookahead = barmerge.lookahead_on)

nonVectorSupertrend(Mult, Period) =>
    [Trail_, Trend_] = supertrend(Mult, Period)
    Trail_*Trend_


[TrailingslHtf, TrendHtf] = supertrend(Mult2, Period2)

if HTF != timeframe.period and HTF != ''
    CompositeTrailHtf = f_Security(syminfo.tickerid, HTF,nonVectorSupertrend(Mult2, Period2) )
    TrailingslHtf := abs(CompositeTrailHtf)
    TrendHtf := CompositeTrailHtf > 0 ? 1 : -1


linecolorHtf = TrendHtf == -1 and TrendHtf[1] == -1 ? color.blue :
   TrendHtf == 1 and TrendHtf[1] == 1 ? color.maroon :
   color.new(color.white, 100)
plot(TrailingslHtf, color = linecolorHtf, linewidth = 3, title = "Supertrend Higher Time Frame")

barcolor_ = Trend == -1 and TrendHtf == -1 ? color.lime :
   Trend == 1 and TrendHtf == 1 ? color.red :
   color.white
barcolor(color = chbarcol ? barcolor_ : na)

vwapfilter = input(false)

Long = Trend == -1 and TrendHtf == -1
Short = Trend == 1 and TrendHtf == 1
strategy.entry("enter long", true, 1, when = Long and not Long[1] and (vwapfilter and close > vwap or not vwapfilter))
strategy.entry("enter short", false, 1, when = Short and not Short[1] and (vwapfilter and close < vwap or not vwapfilter))
strategy.close("enter long", when = Long[1] and not Long)
strategy.close("enter short", when = Short[1] and not Short)