Stratégie de suivi des tendances de Bohr Steel
Aperçu
Cette stratégie est basée sur les bandes de Bohr, les moyennes mobiles et l’analyse des volumes de transactions pour réaliser une stratégie de suivi de tendance robuste. Cette stratégie vise à capturer les revirements de tendance potentiels et à profiter de la dynamique du marché.
Principe de stratégie
Bandes en acier boréale
Utilisation de la bande de acier pour identifier les conditions de survente et de survente du marché. Aide à la décision par une visualisation claire des hauts et des bas.
Le principe de base de la bande d’acier de Bohr est de calculer une trajectoire ascendante et descendante en fonction de la valeur moyenne et de la différence standard du cours de l’action sur un certain cycle. La trajectoire ascendante est un signal de survente et la trajectoire descendante est un signal de survente.
Filtre de moyenne mobile
Les utilisateurs peuvent choisir entre différents types de moyennes mobiles, telles que les moyennes mobiles simples, les moyennes mobiles indexées et les moyennes mobiles pondérées.
Un signal d’achat est généré lorsque le prix franchit la moyenne mobile.
Analyse des résultats
Permet aux utilisateurs d’intégrer l’analyse de la transaction dans la stratégie pour la confirmation du signal. Les colonnes de quantité de différentes couleurs indiquent que la transaction est supérieure ou inférieure à la moyenne.
Le dépassement de la moyenne par le volume de transactions peut être utilisé pour confirmer un signal de prix.
Analyse des avantages
Une solide stratégie de suivi des tendances
Le renversement de tendance est basé sur les bandes de Bol, les moyennes mobiles et les volumes de transactions.
Les prix des produits et services de l’entreprise sont déterminés en fonction de la valeur des produits et des services.
Flexibilité et personnalisation
L’utilisateur peut choisir les paramètres de la bande de Bohr, le type de moyenne mobile et la longueur pour optimiser.
Les positions longues et vides sont contrôlées séparément.
Visualisation et confirmation
Un mécanisme de double signal qui confirme le signal de prix de la bande de acier Boole à l’aide de moyennes mobiles et de volumes de transaction.
Les signaux de trading, tels que les moyennes mobiles, les lignes de stop-loss, etc., sont affichés de manière intuitive.
Gestion des risques
Le stop loss est calculé en fonction de l’ATR. Le cycle ATR et le multiplicateur ATR peuvent être personnalisés.
Ajustez la taille de la position en fonction du pourcentage de risque de détention. Contrôle efficace des pertes individuelles.
Analyse des risques
Risques liés au cycle de rétroaction
- Les différentes périodes historiques peuvent avoir un impact sur la performance de la stratégie. Un retour d’expérience doit être effectué à différentes périodes pour assurer la stabilité de la stratégie.
Risque d’inversion de tendance
- Il est possible de réduire ce risque en optimisant les paramètres des moyennes mobiles.
Risques de sur-optimisation
- L’optimisation multiparamétrique peut conduire à une sur-optimisation. Il convient d’utiliser des combinaisons de paramètres multiples et de procéder à des tests de robustesse.
Risque de retard dans les indicateurs techniques
- Il y a un certain retard dans le calcul de l’indicateur, qui ne peut pas être entièrement dépendant de l’indicateur.
Direction d’optimisation
Optimisation des paramètres
- Optimiser les paramètres de la bande de Bol, les types de moyennes mobiles et les paramètres ATR pour s’adapter à différentes variétés et périodes.
Optimisation de la position
- Tester différents niveaux de pourcentage de risque de détention et optimiser le multiplicateur de stop loss.
Optimisation du signal
- Le test ajoute d’autres indicateurs auxiliaires pour filtrer les signaux, tels que KD, MACD, etc.
Optimisation du code
- Optimisation de la logique de jugement des signaux, réduction des prises de positions inutiles. L’adoption de la programmation orientée objet améliore l’évolutivité.
Résumer
La stratégie intègre les bandes de Bohr, les moyennes mobiles et l’analyse des volumes de transactions pour construire un système de trading mécanique qui suit les tendances. L’avantage de la stratégie réside dans le fait que le mécanisme de confirmation du signal est puissant et que le risque est en place.
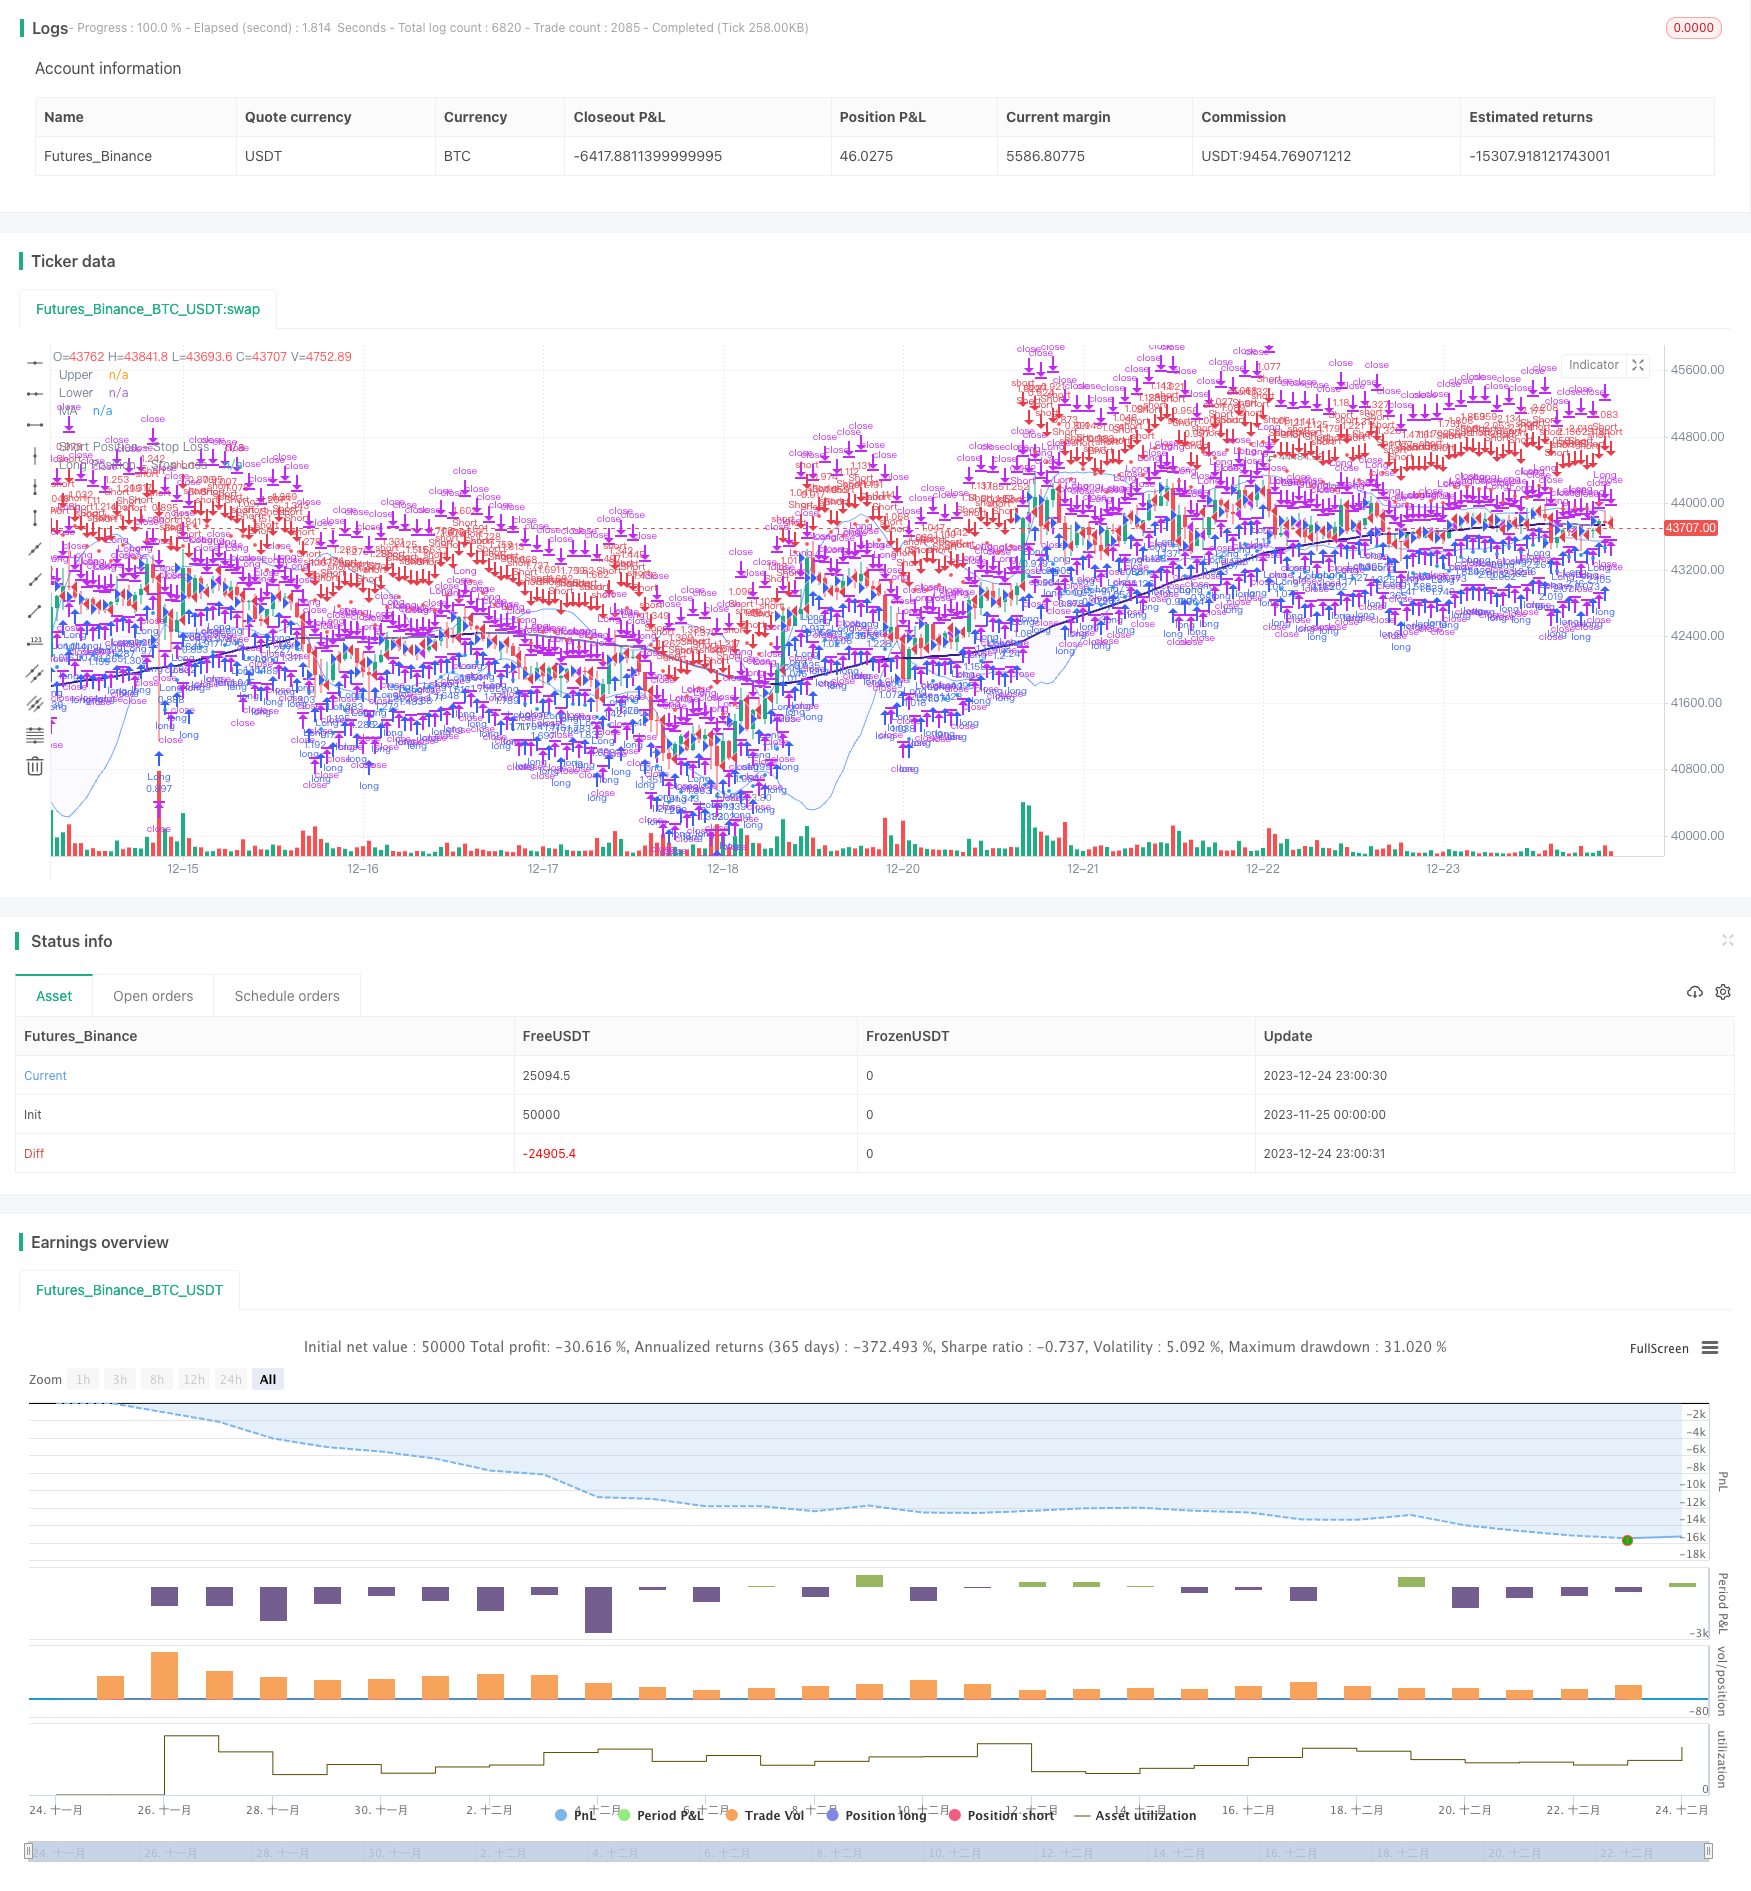
/*backtest
start: 2023-11-25 00:00:00
end: 2023-12-25 00:00:00
period: 1h
basePeriod: 15m
exchanges: [{"eid":"Futures_Binance","currency":"BTC_USDT"}]
*/

// This source code is subject to the terms of the Mozilla Public License 2.0 at https://mozilla.org/MPL/2.0/
// © sosacur01

//@version=5
strategy(title="Bollinger Band | Trend Following", overlay=true, pyramiding=1, commission_type=strategy.commission.percent, commission_value=0.2, initial_capital=10000)

//--------------------------------------

//BACKTEST RANGE
useDateFilter = input.bool(true, title="Filter Date Range of Backtest",
     group="Backtest Time Period")
backtestStartDate = input(timestamp("1 jan 2017"),
     title="Start Date", group="Backtest Time Period",
     tooltip="This start date is in the time zone of the exchange " +
     "where the chart's instrument trades. It doesn't use the time " +
     "zone of the chart or of your computer.")
backtestEndDate = input(timestamp("1 jul 2100"),
     title="End Date", group="Backtest Time Period",
     tooltip="This end date is in the time zone of the exchange " +
     "where the chart's instrument trades. It doesn't use the time " +
     "zone of the chart or of your computer.")
inTradeWindow = true
if not inTradeWindow and inTradeWindow[1]
    strategy.cancel_all()
    strategy.close_all(comment="Date Range Exit")

//--------------------------------------

//LONG/SHORT POSITION ON/OFF INPUT
LongPositions   = input.bool(title='On/Off Long Postion', defval=true, group="Long & Short Position")
ShortPositions  = input.bool(title='On/Off Short Postion', defval=true, group="Long & Short Position")

//--------------------------------------
//MA INPUTS
averageType1    = input.string(defval="WMA", group="MA", title="MA Type", options=["SMA", "EMA", "WMA", "HMA", "RMA", "SWMA", "ALMA", "VWMA", "VWAP"])
averageLength1  = input.int(defval=99, title="MA Lenght", group="MA")
averageSource1  = input(close, title="MA Source", group="MA")

//MA TYPE
MovAvgType1(averageType1, averageSource1, averageLength1) =>
	switch str.upper(averageType1)
        "SMA"  => ta.sma(averageSource1, averageLength1)
        "EMA"  => ta.ema(averageSource1, averageLength1)
        "WMA"  => ta.wma(averageSource1, averageLength1)
        "HMA"  => ta.hma(averageSource1, averageLength1)
        "RMA"  => ta.rma(averageSource1, averageLength1)
        "SWMA" => ta.swma(averageSource1)
        "ALMA" => ta.alma(averageSource1, averageLength1, 0.85, 6)
        "VWMA" => ta.vwma(averageSource1, averageLength1)
        "VWAP" => ta.vwap(averageSource1)
        => runtime.error("Moving average type '" + averageType1 +
             "' not found!"), na


//MA VALUES
ma  = MovAvgType1(averageType1, averageSource1, averageLength1)

//MA CONDITIONS
bullish_ma = close > ma
bearish_ma = close < ma

//PLOT COLOR
ma_plot    = if close > ma
    color.navy
else
    color.rgb(49, 27, 146, 40)

//MA PLOT
plot(ma,color=ma_plot, linewidth=2, title="MA")

//--------------------------------------
//BB INPUTS
length  = input.int(20, minval=1, group="BB")
src     = input(close, title="Source", group="BB")
mult    = input.float(2.0, minval=0.001, maxval=50, title="StdDev", group="BB")

//BB VALUES
basis = ta.sma(src, length)
dev = mult * ta.stdev(src, length)
upper = basis + dev
lower = basis - dev
offset = input.int(0, "Offset", minval = -500, maxval = 500)

//BBPLOT
//plot(basis, "Basis", color=#FF6D00, offset = offset)
p1 = plot(upper, "Upper", color=#2978ffa4, offset = offset)
p2 = plot(lower, "Lower", color=#2978ffa4, offset = offset)
fill(p1, p2, title = "Background", color=color.rgb(33, 47, 243, 97))

//BB ENTRY AND EXIT CONDITIONS
bb_long_entry  = close >= upper
bb_long_exit   = close <= lower
bb_short_entry = close <= lower
bb_short_exit  = close >= upper

//---------------------------------------------------------------
//VOLUME INPUTS
useVolumefilter  = input.bool(title='Use Volume Filter?', defval=false, group="Volume Inputs")
dailyLength      = input.int(title = "MA length", defval = 30, minval = 1, maxval = 100, group = "Volume Inputs")
lineWidth        = input.int(title = "Width of volume bars", defval = 3, minval = 1, maxval = 6, group = "Volume Inputs")
Volumefilter_display  = input.bool(title="Color bars?", defval=false, group="Volume Inputs", tooltip = "Change bar colors when Volume is above average")

//VOLUME VALUES
volumeAvgDaily = ta.sma(volume, dailyLength)

//VOLUME SIGNAL
v_trigger  = (useVolumefilter ? volume > volumeAvgDaily : inTradeWindow)

//PLOT VOLUME SIGNAL
barcolor(Volumefilter_display ? v_trigger ? color.new(#6fe477, 77):na: na, title="Volume Filter")
//---------------------------------------------------------------

//ENTRIES AND EXITS
long_entry  = if inTradeWindow and bullish_ma and bb_long_entry and v_trigger and LongPositions
    true
long_exit   = if inTradeWindow and bb_long_exit
    true

short_entry = if inTradeWindow  and bearish_ma and bb_short_entry and v_trigger and ShortPositions
    true
short_exit  = if inTradeWindow  and bb_short_exit
    true

//--------------------------------------

//RISK MANAGEMENT - SL, MONEY AT RISK, POSITION SIZING
atrPeriod                = input.int(14, "ATR Length", group="Risk Management Inputs")
sl_atr_multiplier        = input.float(title="Long Position - Stop Loss - ATR Multiplier", defval=2, group="Risk Management Inputs", step=0.5)
sl_atr_multiplier_short  = input.float(title="Short Position - Stop Loss - ATR Multiplier", defval=2, group="Risk Management Inputs", step=0.5)
i_pctStop                = input.float(2, title="% of Equity at Risk", step=.5, group="Risk Management Inputs")/100

//ATR VALUE
_atr = ta.atr(atrPeriod)

//CALCULATE LAST ENTRY PRICE
lastEntryPrice = strategy.opentrades.entry_price(strategy.opentrades - 1)

//STOP LOSS - LONG POSITIONS
var float sl = na

//CALCULTE SL WITH ATR AT ENTRY PRICE - LONG POSITION
if (strategy.position_size[1] != strategy.position_size)
    sl := lastEntryPrice - (_atr * sl_atr_multiplier)

//IN TRADE - LONG POSITIONS
inTrade = strategy.position_size > 0

//PLOT SL - LONG POSITIONS
plot(inTrade ? sl : na, color=color.blue, style=plot.style_circles, title="Long Position - Stop Loss")

//CALCULATE ORDER SIZE - LONG POSITIONS
positionSize = (strategy.equity * i_pctStop) / (_atr * sl_atr_multiplier)

//============================================================================================

//STOP LOSS - SHORT POSITIONS
var float sl_short = na

//CALCULTE SL WITH ATR AT ENTRY PRICE - SHORT POSITIONS
if (strategy.position_size[1] != strategy.position_size)
    sl_short := lastEntryPrice + (_atr * sl_atr_multiplier_short)

//IN TRADE SHORT POSITIONS
inTrade_short = strategy.position_size < 0

//PLOT SL - SHORT POSITIONS
plot(inTrade_short ? sl_short : na, color=color.red, style=plot.style_circles, title="Short Position - Stop Loss")

//CALCULATE ORDER - SHORT POSITIONS
positionSize_short = (strategy.equity * i_pctStop) / (_atr * sl_atr_multiplier_short)


//===============================================

//LONG STRATEGY
strategy.entry("Long", strategy.long, comment="Long", when = long_entry, qty=positionSize)
if (strategy.position_size > 0)
    strategy.close("Long", when = (long_exit), comment="Close Long")
    strategy.exit("Long", stop = sl, comment="Exit Long")

//SHORT STRATEGY
strategy.entry("Short", strategy.short, comment="Short", when = short_entry, qty=positionSize_short)
if (strategy.position_size < 0)
    strategy.close("Short", when = (short_exit), comment="Close Short")
    strategy.exit("Short", stop = sl_short, comment="Exit Short")

//ONE DIRECTION TRADING COMMAND (BELLOW ONLY ACTIVATE TO CORRECT BUGS)
//strategy.risk.allow_entry_in(strategy.direction.long)