Stratégie de surachat et de survente avec RSI lent
Aperçu
La stratégie de sur-achat et de sur-vente du RSI lent ouvre de nouvelles opportunités de trading en allongeant le cycle de révision du RSI et en réduisant la volatilité de la courbe RSI. La stratégie s’applique également à d’autres indicateurs techniques tels que le MACD.
Principe de stratégie
L’idée centrale de cette stratégie est d’allonger la durée du cycle de révision du RSI, en prenant 500 cycles par défaut, puis d’aplanir la courbe du RSI par le biais du SMA, avec une courbe par défaut de 250. Cela permet de réduire considérablement la volatilité de la courbe du RSI et de ralentir la vitesse de réaction du RSI, ce qui crée de nouvelles opportunités de trading.
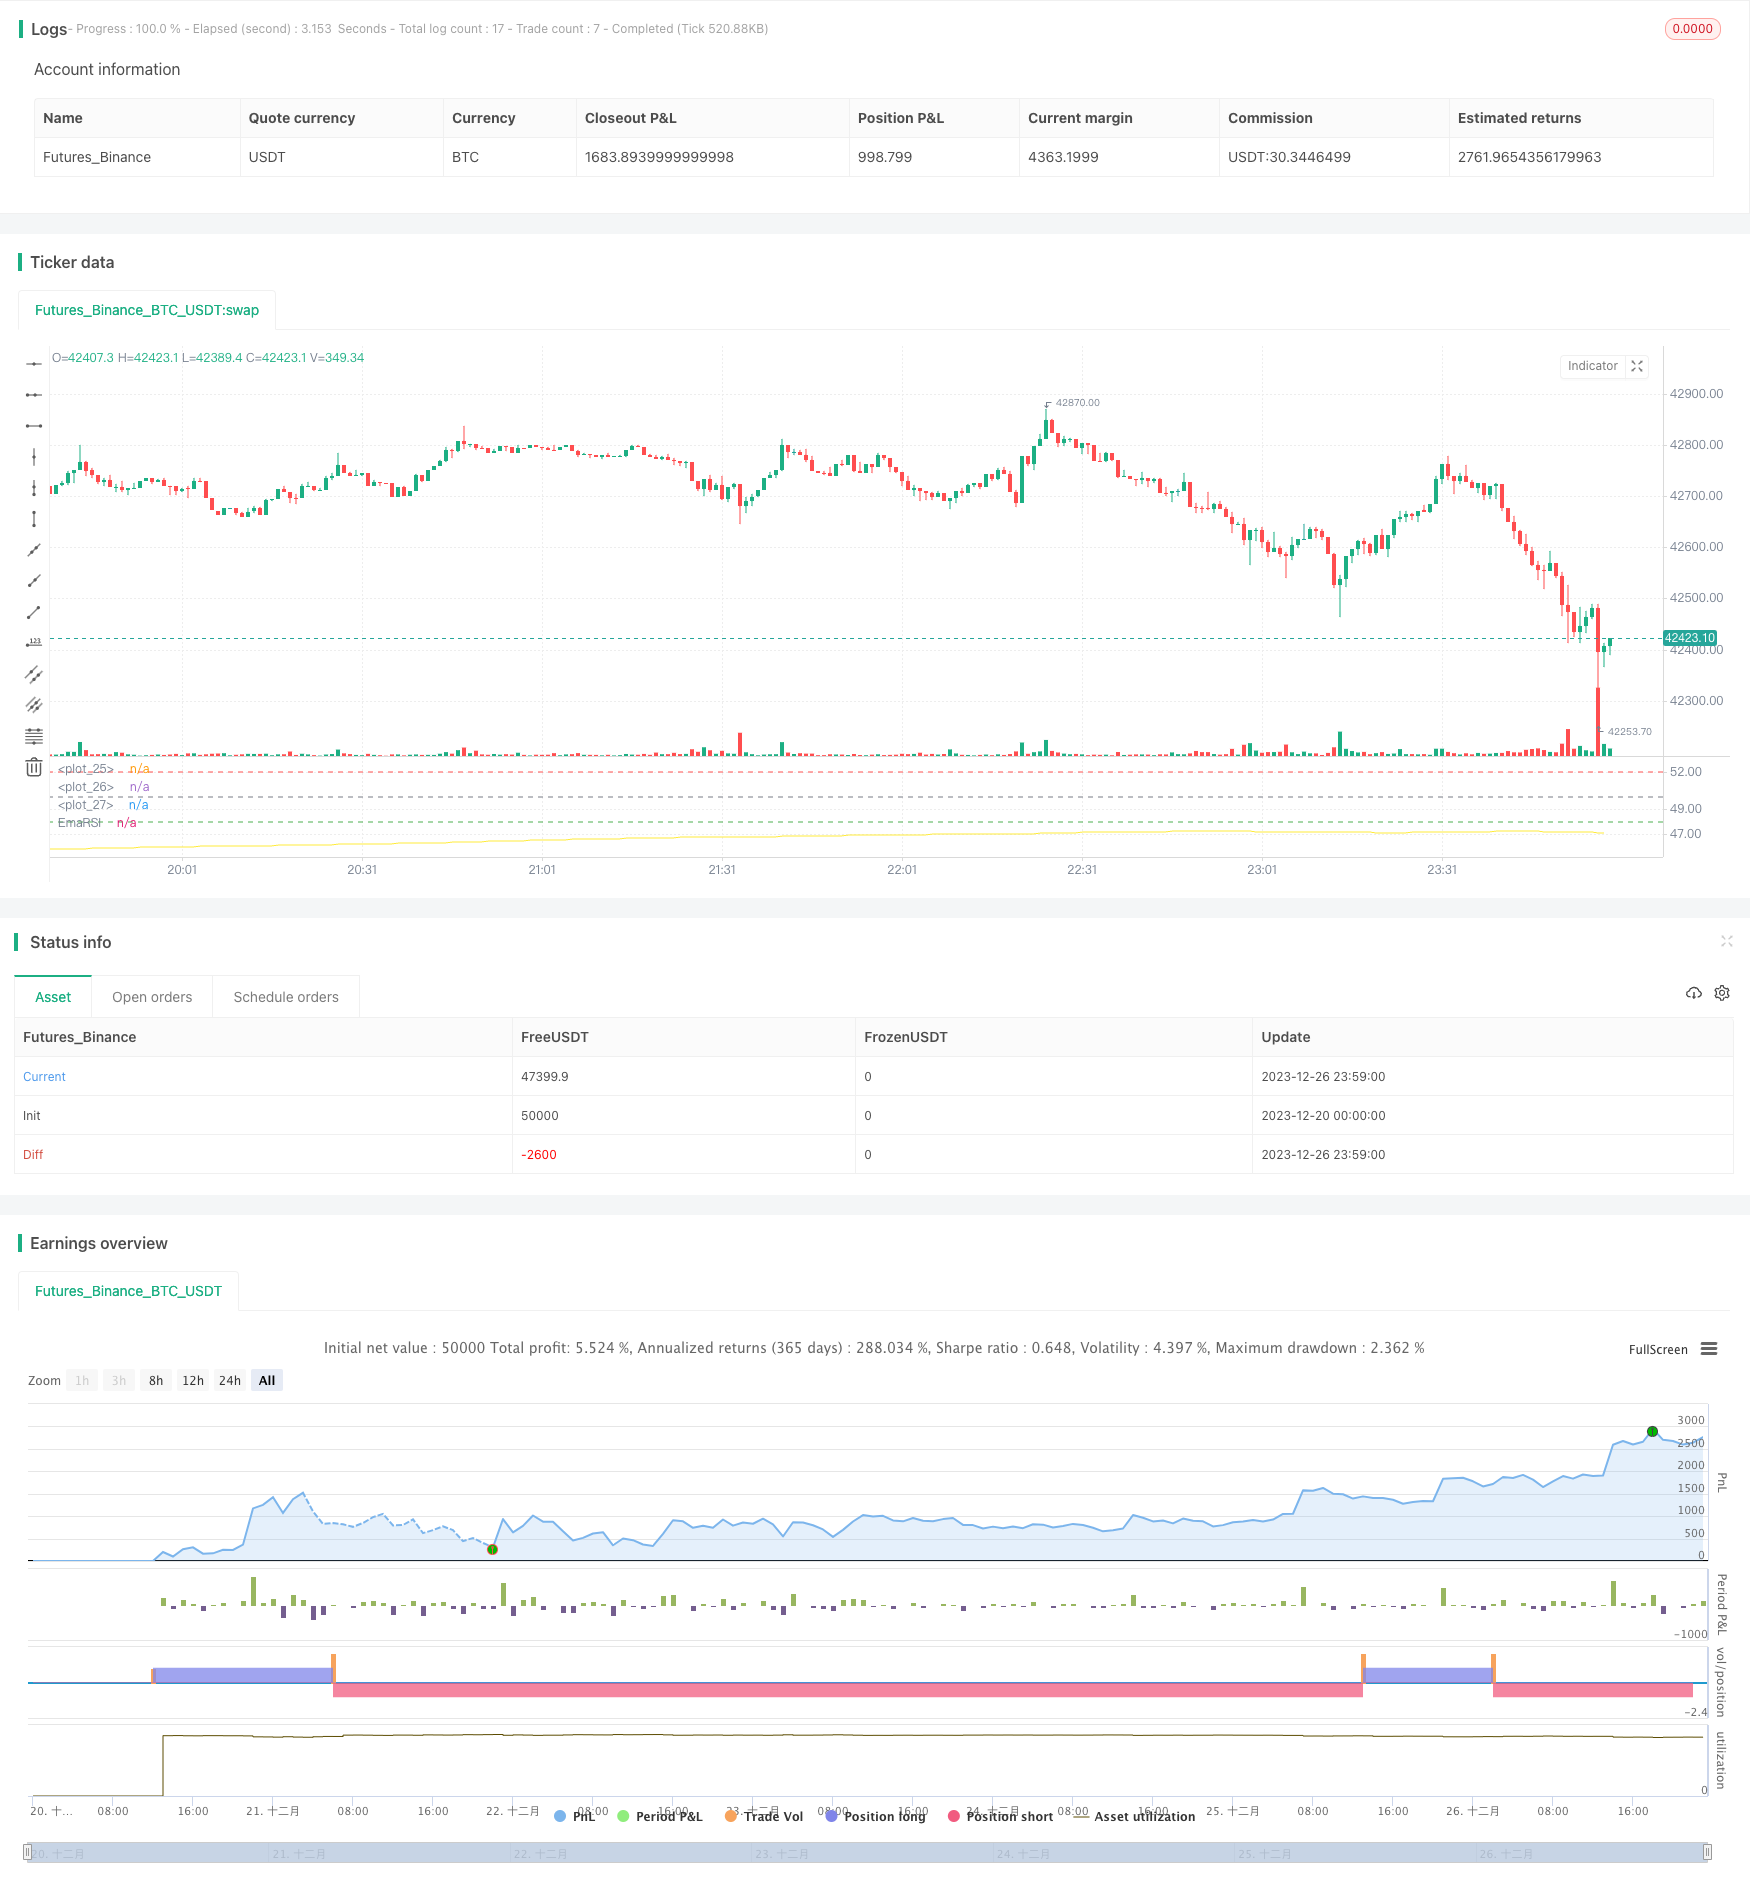
Les cycles de rétroaction trop longs affaiblissent la volatilité de la courbe RSI, de sorte que les critères de jugement des surachats et des surventes doivent également être ajustés. La stratégie définit des lignes de survente 52 et de survente 48 personnalisées. Un signal de survente est généré lorsque le RSI surévalué franchit la ligne de survente en bas et un signal de survente est généré lorsque la ligne de survente est franchie en haut.
Avantages stratégiques
- Les échanges sont innovants et ouvrent de nouvelles voies en allongeant le cycle.
- Il permet de réduire considérablement les faux signaux et d’améliorer la stabilité.
- Il est possible de personnaliser les seuils de sur-achat et de sur-vente pour s’adapter à différents marchés.
- Les graines peuvent être semées pour augmenter le rendement.
Risque stratégique
- Les cycles trop longs peuvent manquer des opportunités de courte durée
- Il faut être patient et attendre que l’occasion se présente.
- Une mauvaise configuration des seuils de survente peut augmenter les pertes
- Le risque de spéculation
La solution est simple:
- Réduire les cycles et augmenter la fréquence des transactions
- La répartition des risques par lots
- Optimiser les paramètres de dépréciation pour s’adapter aux différentes conditions du marché
- Il est important de mettre en place des points de rupture pour éviter des pertes massives.
Orientation de l’optimisation de la stratégie
- Optimiser les paramètres du RSI pour trouver la meilleure combinaison de cycles
- Test de différents paramètres du cycle de lissage SMA
- Optimiser les paramètres de survente pour s’adapter à différents marchés
- Ajout d’une stratégie de stop loss pour contrôler les pertes individuelles
Résumer
La stratégie de sur-achat et de sur-vente sur le RSI lent a réussi à ouvrir de nouvelles voies de négociation en allongeant le cycle et en utilisant la suppression de la fluctuation de la courbe. La stratégie est susceptible d’obtenir des gains supplémentaires stables et efficaces avec des paramètres optimisés et un contrôle du risque en place.
/*backtest
start: 2023-12-20 00:00:00
end: 2023-12-27 00:00:00
period: 1m
basePeriod: 1m
exchanges: [{"eid":"Futures_Binance","currency":"BTC_USDT"}]
*/


// Wilder was a very influential man when it comes to TA. However, I'm one to always try to think outside the box.
// While Wilder recommended that the RSI be used only with a 14 bar lookback period, I on the other hand think there is a lot to learn from RSI if one simply slows down the lookback period
// Same applies for MACD.
// Every market has its dynmaics. So don't narrow your mind by thinking my source code input levels are the only levels that work.
// Since the long lookback period weakens the plot volatility, again, one must think outside the box when trying to guage overbought and oversold levels.

// Good luck and don't bash me if some off-the-wall FA spurned divergence causes you to lose money.
// And NO this doesn't repaint and I won't answer those who ask.
//@version=4

strategy("SLOW RSI OB/OS Strategy", overlay=false)
price = input(ohlc4, title="Price Source")
len = input(500, minval=1, step=5,  title="RSI Length")
smoother = input(250, minval=1, step=5, title="RSI SMA")
up = rma(max(change(price), 0), len)
down = rma(-min(change(price), 0), len)
rsi = down == 0 ? 100 : up == 0 ? 0 : 100 - (100 / (1 + up / down))
EmaRSI = ema(rsi,smoother)
plot(EmaRSI, title="EmaRSI", style=line, linewidth=1, color=yellow)


OB = input(52, step=0.1)
OS = input(48, step=0.1)
hline(OB, linewidth=1, color=red)
hline(OS,linewidth=1, color=green)
hline(50,linewidth=1, color=gray)


long = change(EmaRSI) > 0 and EmaRSI <= 50 and crossover(EmaRSI, OS)
short = change(EmaRSI) < 0 and EmaRSI >= 50 and crossunder(EmaRSI, OB)


strategy.entry("Long", strategy.long, when=long) //_signal or long) //or closeshort_signal)
strategy.entry("Short", strategy.short, when=short) //_signal or short) // or closelong_signal)

// If you want to try to play with exits you can activate these!

//closelong = crossunder(EmaRSI, 0) //or crossunder(EmaRSI, OS)
//closeshort = crossover(EmaRSI, 0) //or crossover(EmaRSI, OB)

//strategy.close("Long", when=closelong)
//strategy.close("Short", when=closeshort)