Stratégie de tendance croisée de la mort Double EMA Golden Cross
Date de création:
2023-12-29 15:46:15
Dernière modification:
2023-12-29 15:46:15
Copier:
2
Nombre de clics:
835
1
Suivre
1750
Abonnés
Aperçu
Cette stratégie utilise les deux indicateurs EMA pour déterminer la direction de la tendance actuelle et, en combinaison avec l’indicateur RSI, pour éviter de manquer des opportunités d’achat ou de vente, est une stratégie de suivi de tendance typique.
Principe de stratégie
- Les moyennes EMA des périodes 10 et 20, nommées respectivement ma00 et ma01
- Un signal d’achat est généré lorsque ma00 est porté sur ma01
- Un signal de vente est généré lorsque le ma00 passe sous le ma01
- En même temps, lorsque le prix monte de ma00, un signal d’achat est également généré si ma00 est supérieur à ma01
- De même, lorsque le prix est inférieur à ma00, un signal de vente est généré si ma00 est inférieur à ma01
- Ce double jugement permet d’éviter de rater certains points de vente.
- La mise en place d’un prix de stop-loss et d’un prix d’arrêt permettant une maîtrise des risques
Analyse des avantages
- Le double jugement EMA permet de filtrer efficacement les fausses intrusions
- Le double conditionnel pour éviter la fuite
- Le paramètre Stop Loss Stop est favorable au contrôle des risques
Analyse des risques
- La double EMA est une stratégie de suivi de la tendance, qui est souvent achetée et vendue dans des conditions de choc, et qui est facile à arrêter.
- L’incapacité à déterminer avec précision le point de basculement de la tendance pourrait entraîner des pertes
- Une mauvaise configuration du point de rupture peut augmenter les pertes.
Direction d’optimisation
- Les cycles EMA peuvent être optimisés de manière appropriée pour rechercher la meilleure combinaison de paramètres
- Les autres indicateurs peuvent être ajoutés pour améliorer la stabilité stratégique.
- Il est possible de définir un stop-loss dynamique, qui s’adapte en temps réel aux fluctuations du marché.
Code source de la stratégie
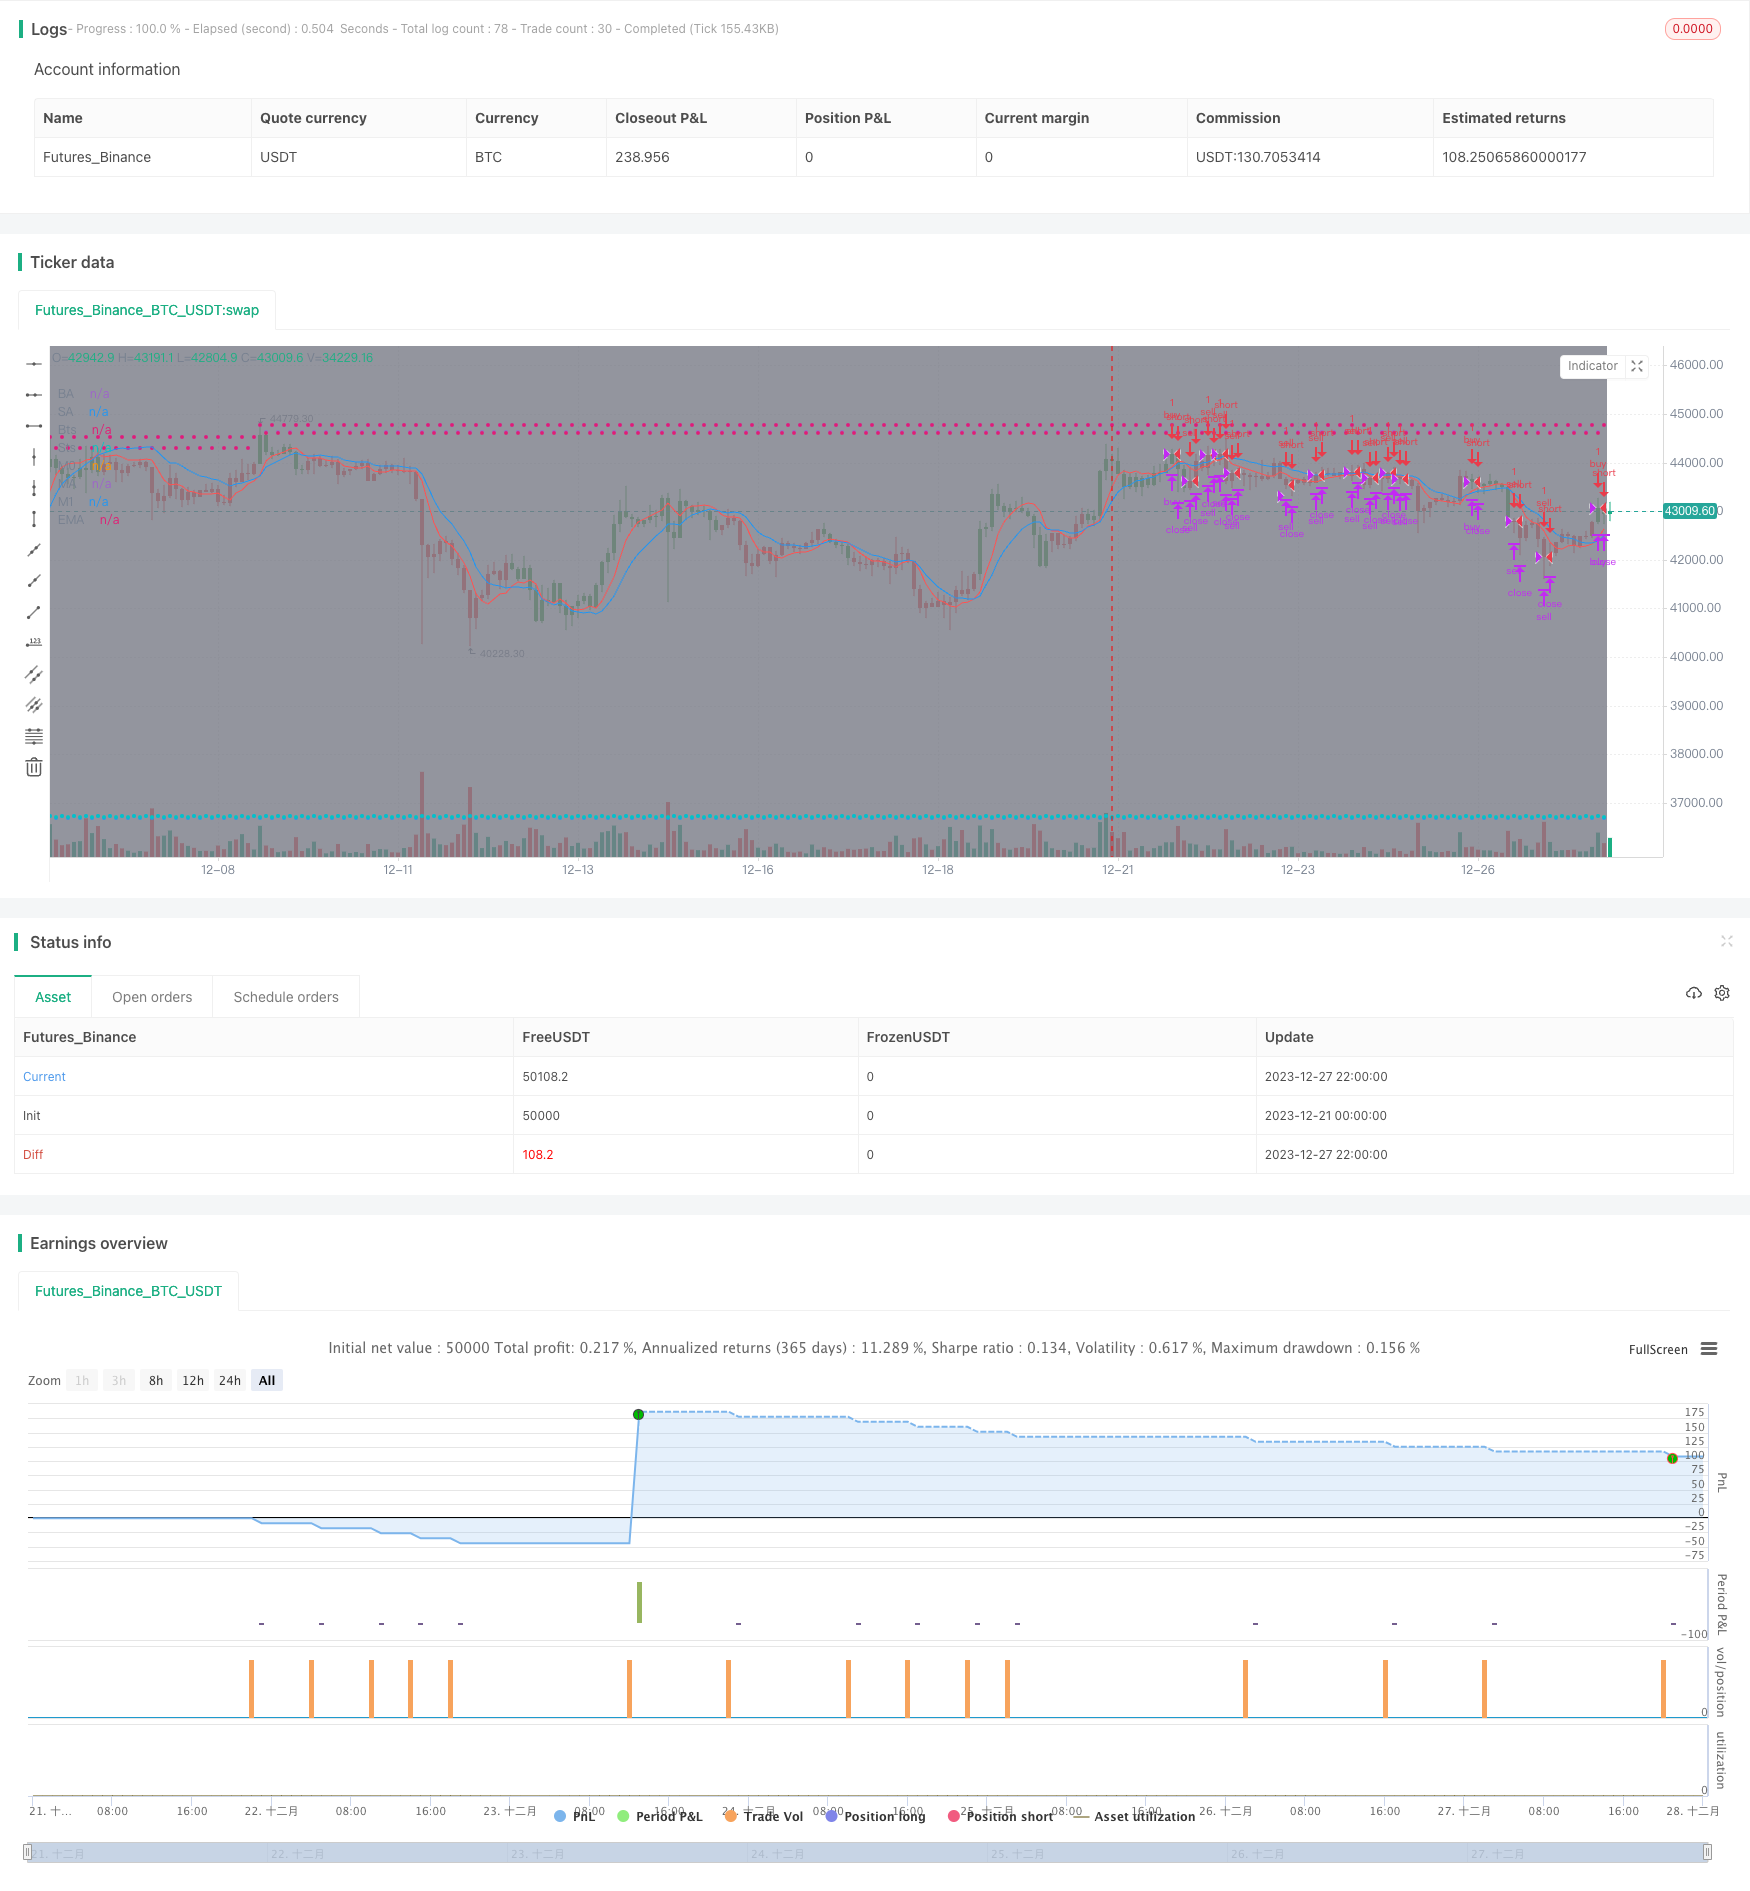
/*backtest
start: 2023-12-21 00:00:00
end: 2023-12-28 00:00:00
period: 2h
basePeriod: 15m
exchanges: [{"eid":"Futures_Binance","currency":"BTC_USDT"}]
*/

//@version=4

strategy(title='[STRATEGY][RS]MicuRobert EMA cross V1', shorttitle='S', overlay=true, pyramiding=0, initial_capital=100000)
USE_TRADESESSION = input(title='Use Trading Session?', type=bool, defval=true)
USE_TRAILINGSTOP = input(title='Use Trailing Stop?', type=bool, defval=true)
trade_session = input(title='Trade Session:',  defval='0400-1500', confirm=false)
istradingsession = not USE_TRADESESSION ? false : not na(time('1', trade_session))
bgcolor(istradingsession?color.gray:na)
trade_size = input(title='Trade Size:', type=float, defval=1)
tp = input(title='Take profit in pips:', type=float, defval=55.0) * (syminfo.mintick*10)
sl = input(title='Stop loss in pips:', type=float, defval=11.0) * (syminfo.mintick*10)
ma_length00 = input(title='EMA length:',  defval=10)
ma_length01 = input(title='DEMA length:',  defval=20)
price = input(title='Price source:', defval=open)

//  ||--- NO LAG EMA, Credit LazyBear:  ---||
f_LB_zlema(_src, _length)=>
    _ema1=ema(_src, _length)
    _ema2=ema(_ema1, _length)
    _d=_ema1-_ema2
    _zlema=_ema1+_d
//  ||-------------------------------------||

ma00 = f_LB_zlema(price, ma_length00)
ma01 = f_LB_zlema(price, ma_length01)
plot(title='M0', series=ma00, color=black)
plot(title='M1', series=ma01, color=black)

isnewbuy = change(strategy.position_size)>0 and change(strategy.opentrades)>0
isnewsel = change(strategy.position_size)<0 and change(strategy.opentrades)>0

buy_entry_price = isnewbuy ? price : buy_entry_price[1]
sel_entry_price = isnewsel ? price : sel_entry_price[1]
plot(title='BE', series=buy_entry_price, style=circles, color=strategy.position_size <= 0 ? na : aqua)
plot(title='SE', series=sel_entry_price, style=circles, color=strategy.position_size >= 0 ? na : aqua)
buy_appex = na(buy_appex[1]) ? price : isnewbuy ? high : high >= buy_appex[1] ? high : buy_appex[1]
sel_appex = na(sel_appex[1]) ? price : isnewsel ? low : low <= sel_appex[1] ? low : sel_appex[1]
plot(title='BA', series=buy_appex, style=circles, color=strategy.position_size <= 0 ? na : teal)
plot(title='SA', series=sel_appex, style=circles, color=strategy.position_size >= 0 ? na : teal)
buy_ts = buy_appex - sl
sel_ts = sel_appex + sl
plot(title='Bts', series=buy_ts, style=circles, color=strategy.position_size <= 0 ? na : red)
plot(title='Sts', series=sel_ts, style=circles, color=strategy.position_size >= 0 ? na : red)

buy_cond1 = crossover(ma00, ma01) and (USE_TRADESESSION ? istradingsession : true)
buy_cond0 = crossover(price, ma00) and ma00 > ma01 and (USE_TRADESESSION ? istradingsession : true)
buy_entry = buy_cond1 or buy_cond0
buy_close = (not USE_TRAILINGSTOP ? false : low <= buy_ts) or high>=buy_entry_price+tp//high>=last_traded_price + tp or low<=last_traded_price - sl //high >= hh or
sel_cond1 = crossunder(ma00, ma01) and (USE_TRADESESSION ? istradingsession : true)
sel_cond0 = crossunder(price, ma00) and ma00 < ma01 and (USE_TRADESESSION ? istradingsession : true)
sel_entry = sel_cond1 or sel_cond0
sel_close = (not USE_TRAILINGSTOP ? false : high >= sel_ts) or low<=sel_entry_price-tp//low<=last_traded_price - tp or high>=last_traded_price + sl //low <= ll or

strategy.entry('buy', long=strategy.long, qty=trade_size, comment='buy', when=buy_entry)
strategy.close('buy', when=buy_close)
strategy.entry('sell', long=strategy.short, qty=trade_size, comment='sell', when=sel_entry)
strategy.close('sell', when=sel_close)

//What i add .!
pos = iff(ma01 < ma00 , 1,
	    iff(ma01 > ma00 , -1, nz(pos[1], 0)))
barcolor(pos == -1 ? red: pos == 1 ? green : blue)
plot(ma00, color=red, title="MA")
plot(ma01, color=blue, title="EMA")