Stratégie de suivi quantitatif du marché haussier
Aperçu
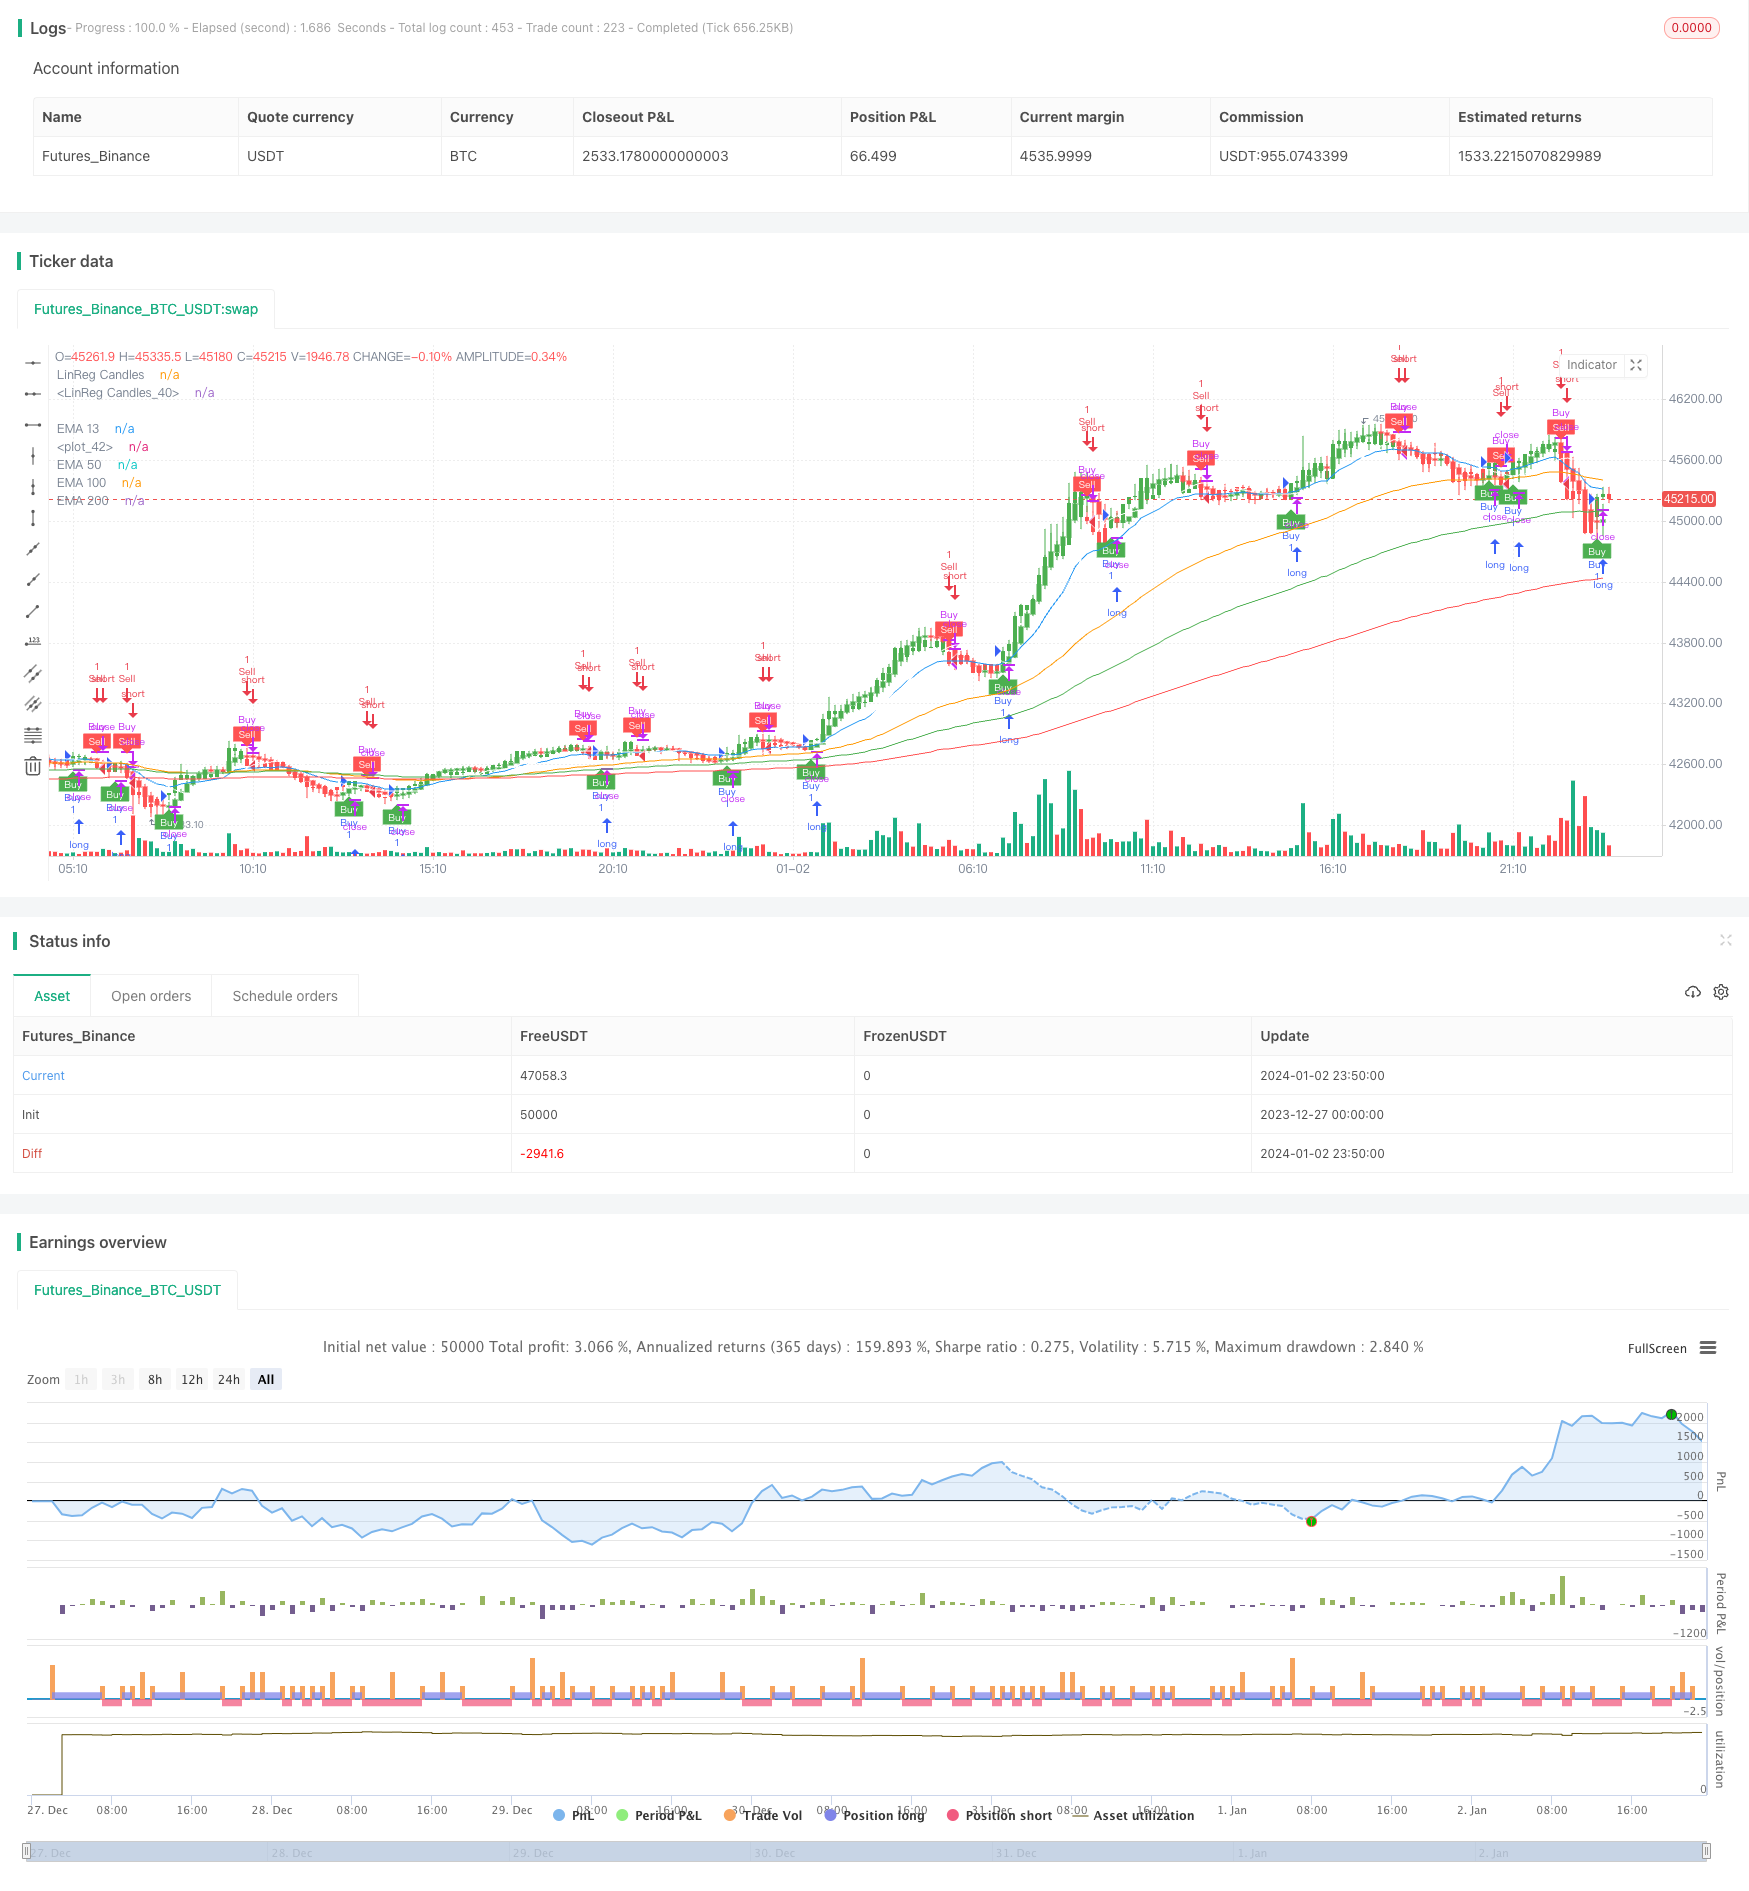
La stratégie de suivi quantitatif du bull market est une stratégie de suivi de la tendance basée sur les moyennes EMA et les arrêts ATR. Elle utilise les moyennes EMA pour déterminer la direction des grandes tendances et utilise les arrêts ATR dynamiques pour verrouiller les gains de tendance et maximiser les gains.
Principe de stratégie
La stratégie est principalement composée des éléments suivants:
- La courbe moyenne de l’EMA est la principale tendance
Les lignes de 13, 50 et 100 jours constituent un point de vue polyvalent permettant de juger des principales tendances.
- Arrêt de la dynamique ATR
L’indicateur ATR est utilisé pour calculer la portée des variations de prix au cours de la période, afin de définir le point de rupture et d’obtenir un arrêt de rupture.
- Le signal est lisse.
Un SMA de fin de cycle est effectué sur la ligne K afin d’éviter les faux signaux.
- Signaux en plein air
Faire plus lorsque le prix est au-dessus de la moyenne EMA, faire moins lorsque le prix est en dessous de la moyenne EMA.
Analyse des avantages
Cette stratégie présente les avantages suivants:
- Le contrôle de la rétraction est excellent, la rétraction maximale peut être contrôlée à moins de 160%.
- Le suivi des stop-loss est plus intelligent que le stop-loss fixe, et permet de localiser plus de tendances pour réaliser des bénéfices.
- L’EMA peut être utilisée pour déterminer la direction de la tendance principale et éviter les inversions.
- La ligne K est lisse et permet de filtrer les fausses signaux, ce qui augmente le taux de victoire.
Analyse des risques
Cette stratégie comporte aussi des risques:
- Les paramètres fixes peuvent ne pas être adaptés aux différentes variétés et doivent être optimisés.
- Les tremblements de terre peuvent provoquer des sauts d’arrêt.
- Il est nécessaire de maintenir la stabilité du serveur pour éviter de manquer le signal.
Il est possible de réduire ces risques par des mesures telles que l’optimisation des paramètres et les tests d’adaptation.
Direction d’optimisation
Cette stratégie peut être optimisée dans les directions suivantes:
- Optimisation automatique des paramètres à l’aide d’algorithmes d’apprentissage automatique.
- L’augmentation des mécanismes d’arrêt des pertes adaptés aux conditions du marché.
- Augmentation des conditions de sélection composite et stabilité des stratégies.
- L’adaptation des stratégies devrait être envisagée dans le cadre d’essais transgenres.
Résumer
La stratégie est globalement une stratégie quantitative basée sur la conception de la méthode de suivi de la tendance. Elle utilise l’EMA pour déterminer la direction de la tendance, tout en utilisant l’ATR pour effectuer des arrêts intelligents.
/*backtest
start: 2023-12-27 00:00:00
end: 2024-01-03 00:00:00
period: 10m
basePeriod: 1m
exchanges: [{"eid":"Futures_Binance","currency":"BTC_USDT"}]
*/

//@version=4
strategy("Combined Strategy", overlay=true)

// Input variables for EMA Crossover
ema13_length = input(13, title="EMA 13 Length")
ema50_length = input(50, title="EMA 50 Length")
ema100_length = input(100, title="EMA 100 Length")
ema200_length = input(200, title="EMA 200 Length")

// Calculate EMAs for EMA Crossover
ema13 = ema(close, ema13_length)
ema50 = ema(close, ema50_length)
ema100 = ema(close, ema100_length)
ema200 = ema(close, ema200_length)

// Plot EMAs for EMA Crossover
plot(ema13, color=color.blue, title="EMA 13")
plot(ema50, color=color.orange, title="EMA 50")
plot(ema100, color=color.green, title="EMA 100")
plot(ema200, color=color.red, title="EMA 200")

// Input variables for LinReg Candles
signal_length = input(title="Signal Smoothing", type=input.integer, minval=1, maxval=200, defval=11)
sma_signal = input(title="Simple MA (Signal Line)", type=input.bool, defval=true)

lin_reg = input(title="Lin Reg", type=input.bool, defval=true)
linreg_length = input(title="Linear Regression Length", type=input.integer, minval=1, maxval=200, defval=11)

// Calculate LinReg Candles
bopen = lin_reg ? linreg(open, linreg_length, 0) : open
bhigh = lin_reg ? linreg(high, linreg_length, 0) : high
blow = lin_reg ? linreg(low, linreg_length, 0) : low
bclose = lin_reg ? linreg(close, linreg_length, 0) : close

r = bopen < bclose

signal = sma_signal ? sma(bclose, signal_length) : ema(bclose, signal_length)

plotcandle(r ? bopen : na, r ? bhigh : na, r ? blow: na, r ? bclose : na, title="LinReg Candles", color=color.green, wickcolor=color.green, bordercolor=color.green, editable=true)
plotcandle(r ? na : bopen, r ? na : bhigh, r ? na : blow, r ? na : bclose, title="LinReg Candles", color=color.red, wickcolor=color.red, bordercolor=color.red, editable=true)

plot(signal, color=color.white)

// Input variables for UT Bot Alerts
a = input(1, title="Key Value. 'This changes the sensitivity'")
c = input(10, title="ATR Period")
h = input(false, title="Signals from Heikin Ashi Candles")

// Calculate UT Bot Alerts
xATR = atr(c)
nLoss = a * xATR

src = h ? security(heikinashi(syminfo.tickerid), timeframe.period, close, lookahead=false) : close

xATRTrailingStop = 0.0
xATRTrailingStop := iff(src > nz(xATRTrailingStop[1], 0) and src[1] > nz(xATRTrailingStop[1], 0), max(nz(xATRTrailingStop[1]), src - nLoss),
   iff(src < nz(xATRTrailingStop[1], 0) and src[1] < nz(xATRTrailingStop[1], 0), min(nz(xATRTrailingStop[1]), src + nLoss),
   iff(src > nz(xATRTrailingStop[1], 0), src - nLoss, src + nLoss)))

pos = 0
pos := iff(src[1] < nz(xATRTrailingStop[1], 0) and src > nz(xATRTrailingStop[1], 0), 1,
   iff(src[1] > nz(xATRTrailingStop[1], 0) and src < nz(xATRTrailingStop[1], 0), -1, nz(pos[1], 0)))

xcolor = pos == -1 ? color.red: pos == 1 ? color.green : color.blue

ema = ema(src,1)
above = crossover(ema, xATRTrailingStop)
below = crossover(xATRTrailingStop, ema)

buy = src > xATRTrailingStop and above
sell = src < xATRTrailingStop and below

barbuy = src > xATRTrailingStop
barsell = src < xATRTrailingStop

strategy.entry("Buy", strategy.long, when=buy)
strategy.close("Buy", when=sell)
strategy.entry("Sell", strategy.short, when=sell)
strategy.close("Sell", when=buy)

plotshape(buy, title="Buy", text='Buy', style=shape.labelup, location=location.belowbar, color=color.green, textcolor=color.white, transp=0, size=size.tiny)
plotshape(sell, title="Sell", text='Sell', style=shape.labeldown, location=location.abovebar, color=color.red, textcolor=color.white, transp=0, size=size.tiny)

barcolor(barbuy ? color.green : na)
barcolor(barsell ? color.red : na)

alertcondition(buy, "UT Long", "UT Long")
alertcondition(sell, "UT Short", "UT Short")