Stratégie de trading quantitative basée sur Ichimoku Kinko Hyo et l'indice directionnel moyen
Aperçu
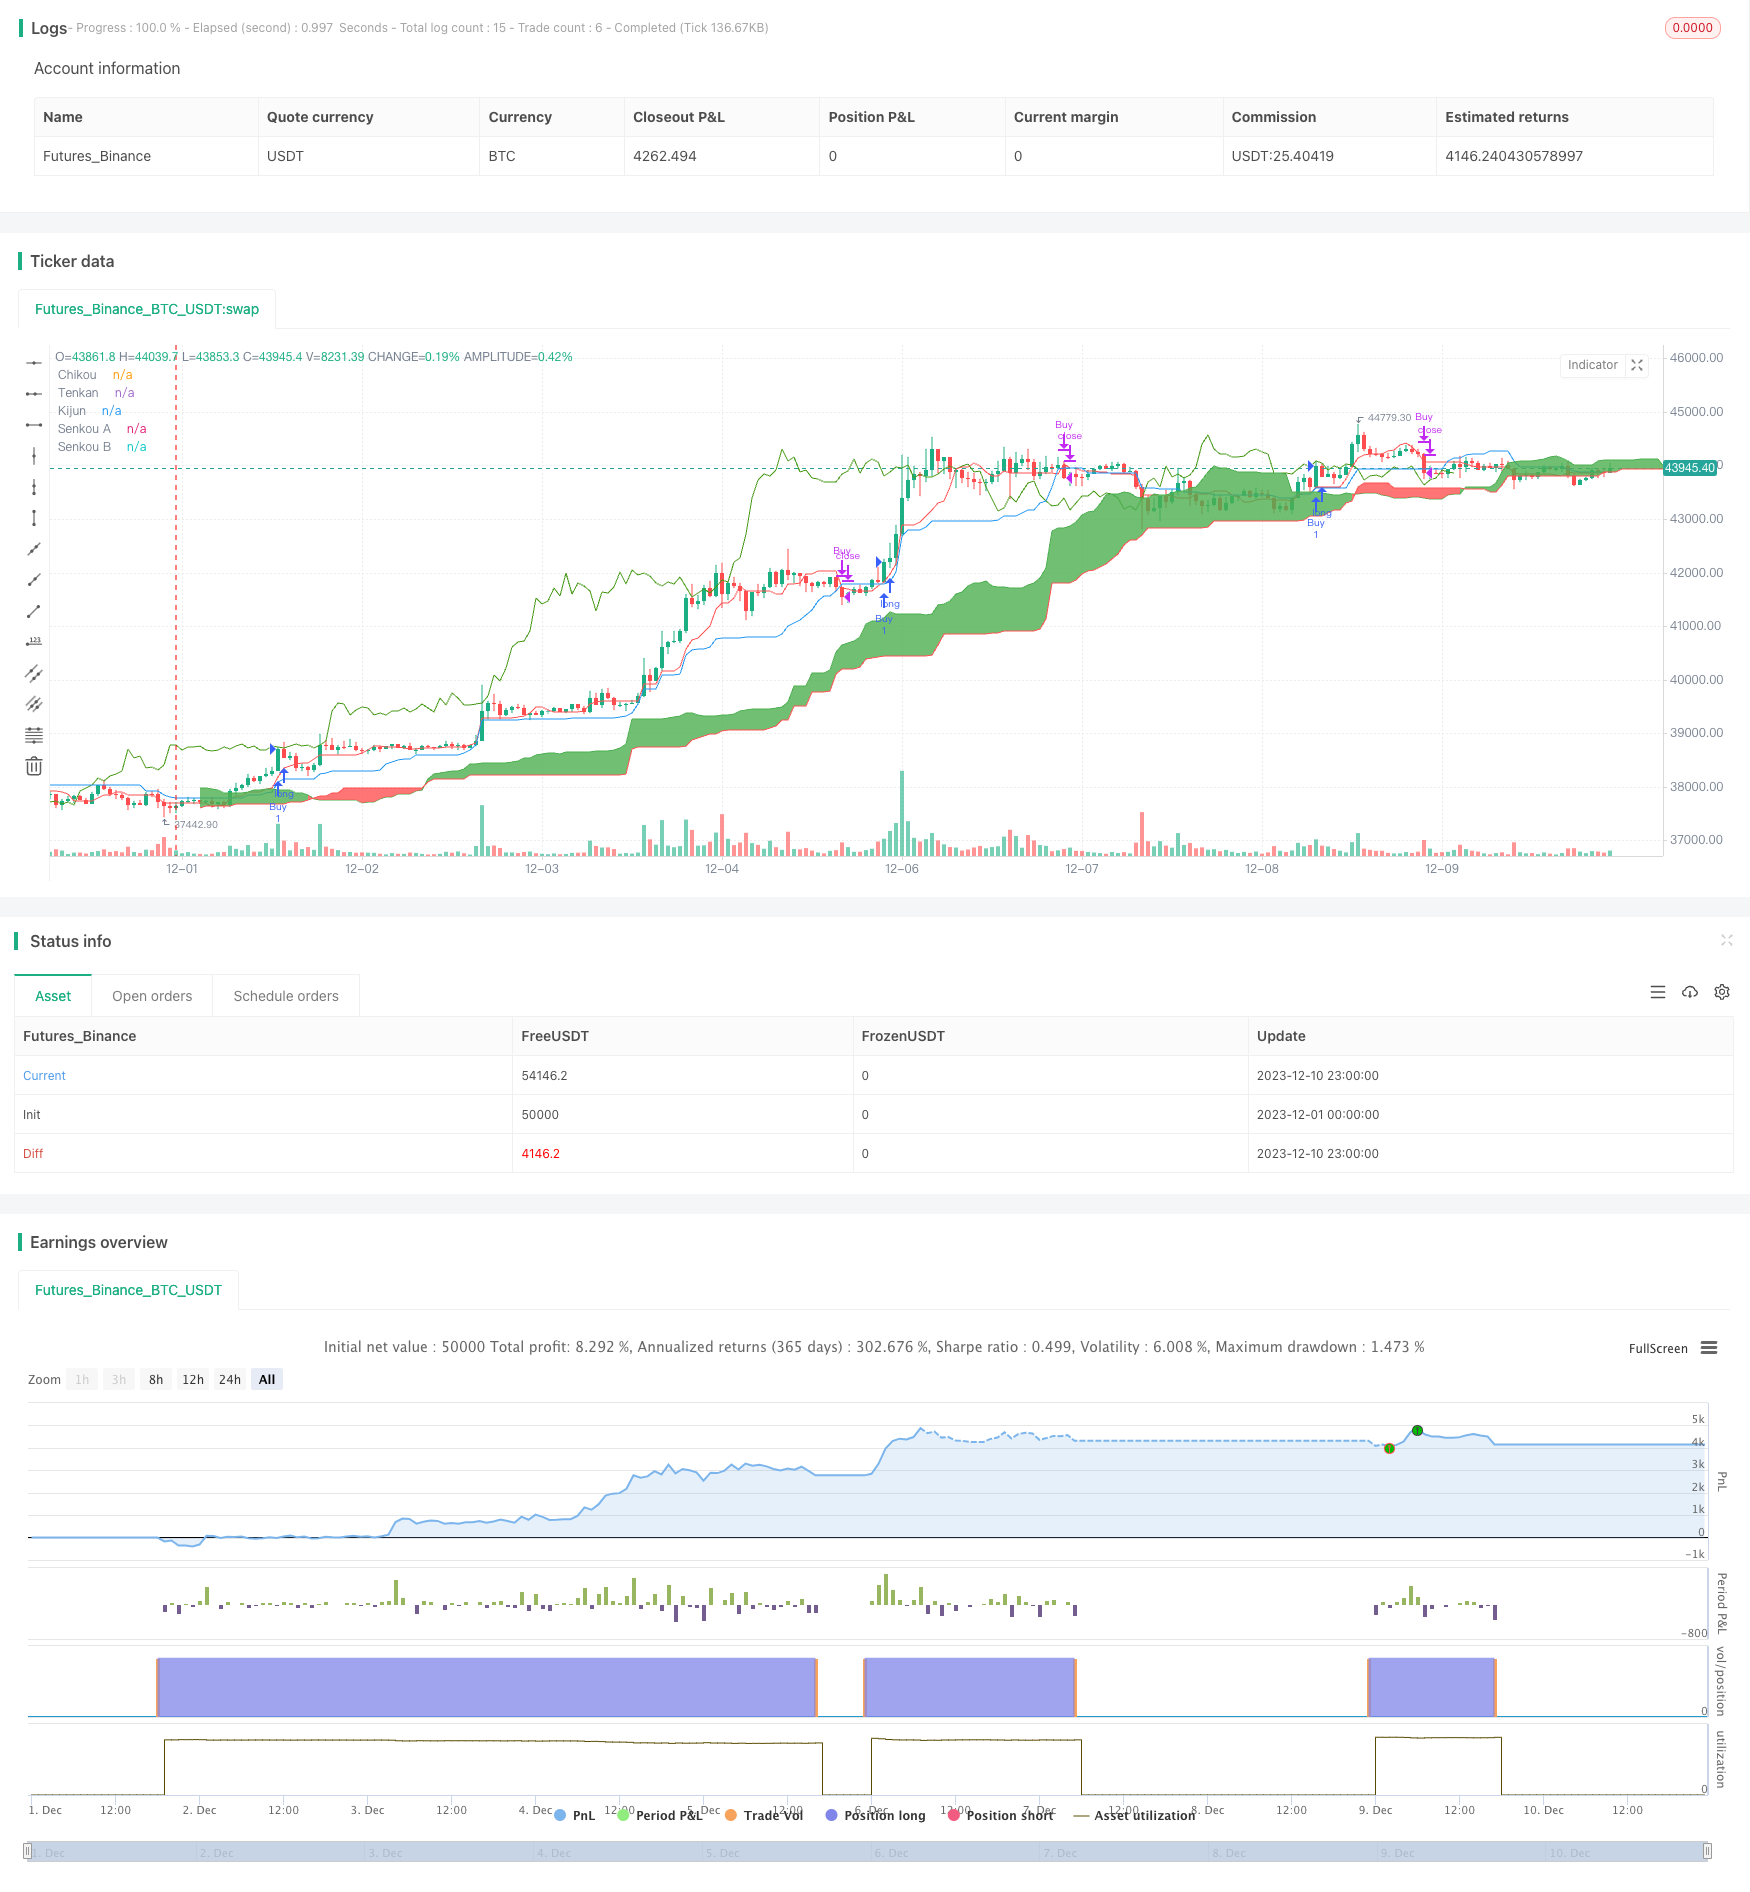
Cette stratégie utilise l’équilibre à vue et l’indice de direction moyen (ADX) pour identifier les tendances et les points de résistance de soutien essentiels des prix des actions, afin d’émettre des signaux d’achat et de vente. Cette stratégie vise à capturer les fluctuations de prix plus importantes dans des conditions de tendance.
Principe de stratégie
Le tableau d’équilibre contient trois moyennes mobiles: la ligne de conversion avant, la ligne de référence et la ligne de retard. Un signal de vente est émis lorsque le prix est au-dessus de la ligne de conversion avant et de la ligne de référence; un signal de vente est émis lorsque le prix est au-dessous de ces deux lignes.
L’ADX est utilisé pour déterminer la force de la tendance des prix. Lorsque +DI et -DI sont clairement séparés, il indique une tendance; lorsque +DI et -DI sont proches, il indique une tendance à la reprise.
L’utilisation combinée de la courbe de tendance de l’équilibre à première vue et du filtrage de l’ADX sur la force de la tendance permet d’identifier efficacement les segments de tendance où les prix sont plus volatiles.
Avantages stratégiques
- L’utilisation d’une combinaison de deux indicateurs rend les signaux de trading plus fiables
- L’utilisation de l’ADX évite les erreurs de transaction lors de la mise au point
- Le retour d’expérience est bon, les gains sont plus risqués
Analyse des risques
- Cette stratégie est plus adaptée aux actions tendances, et les signaux pour les actions consolidées peuvent être moins nombreux.
- Le premier équilibre a lui-même des problèmes de retard de réponse et pourrait manquer une occasion de revenir rapidement.
- Le jugement de l’ADX sur le bilan n’est pas parfait, il peut y avoir des erreurs
Direction d’optimisation
- On peut tester différentes combinaisons de paramètres, telles que le réglage de la période de la ligne de conversion, de la ligne de référence
- Peut être optimisé en combinaison avec d’autres indicateurs tels que MACD, KD, etc.
- On peut étudier différentes règles ou conditions de filtrage ADX
Résumer
Cette stratégie permet une capture efficace de l’évolution des tendances grâce à une combinaison efficace de l’équilibre au premier coup d’œil et de l’ADX. Sur la base d’une optimisation supplémentaire des paramètres et des règles, la stratégie permet d’obtenir une meilleure rétroaction et une meilleure performance en bourse.
/*backtest
start: 2023-12-01 00:00:00
end: 2023-12-10 23:59:59
period: 1h
basePeriod: 15m
exchanges: [{"eid":"Futures_Binance","currency":"BTC_USDT"}]
*/

//@version=4
strategy(title="Ichimoku + ADX", shorttitle="Ichimoku & ADX Backtest", overlay=true)

//------------------------------
//------------------------------
// ICHIMOKU
//------------------------------
//------------------------------

conversionPeriods = input(9, minval=1, title="Conversion Line Periods"),
basePeriods = input(26, minval=1, title="Base Line Periods")
laggingSpan2Periods = input(52, minval=1, title="Lagging Span 2 Periods"),
displacement = input(26, minval=1, title="Displacement")

donchian(len) => avg(lowest(len), highest(len))

Tenkan = donchian(conversionPeriods)
Kijun = donchian(basePeriods)
SSA = avg(Tenkan, Kijun)
SSB = donchian(laggingSpan2Periods)

SSAdisp = SSA[displacement]
SSBdisp = SSB[displacement]

// Plot Ichimoku
// --------------------

plot(Tenkan, color=color.red, title="Tenkan")
plot(Kijun, color=color.blue, title="Kijun")
plot(close, offset = -displacement + 1, color=#459915, title="Chikou")


p1 = plot(SSA, offset = displacement - 1, color=color.green,
 title="Senkou A")
p2 = plot(SSB, offset = displacement - 1, color=color.red,
 title="Senkou B")
fill(p1, p2, color = SSA > SSB ? color.green : color.red)

//------------------------------
//------------------------------
// ADX
//------------------------------
//------------------------------

adxlen = input(14, title="ADX Smoothing")
dilen = input(14, title="DI Length")
keyLevel = input(23, title="key level for ADX")
dirmov(len) =>
	up = change(high)
	down = -change(low)
	truerange = rma(tr, len)
	plus = fixnan(100 * rma(up > down and up > 0 ? up : 0, len) / truerange)
	minus = fixnan(100 * rma(down > up and down > 0 ? down : 0, len) / truerange)
	[plus, minus]

adx(dilen, adxlen) =>
	[plus, minus] = dirmov(dilen)
	sum = plus + minus
	adx = 100 * rma(abs(plus - minus) / (sum == 0 ? 1 : sum), adxlen)
	[adx, plus, minus]

[sig, up, down] = adx(dilen, adxlen)

// Plot ADX
// --------------------

//plot(sig, color=color.black, title="ADX")
//plot(up, color=color.green, title="+DI",linewidth=2, style=plot.style_columns, transp=40)
//plot(down, color=color.red, title="-DI",linewidth=2, style=plot.style_columns, transp=40)
//plot(keyLevel, color=color.white, title="Key Level")


//------------------------------
//------------------------------
// STRATEGY
//------------------------------
//------------------------------

// Buy & Sell Signals
// --------------------

// ADX
ABuy1 = up > keyLevel and up - down >5 and sig > down and sig < keyLevel * 2
ASell1 = down > keyLevel and down - up >5 and sig > up and sig < keyLevel * 2


// ICHIMOKU

Bull = close >= max(SSAdisp, SSBdisp)
Bear = close <= min(SSAdisp, SSBdisp)

//  1. Bull
Buy1 = (close >= max(SSAdisp, SSBdisp)) ? 1 : 0
Buy2 = (Tenkan - Kijun >= 0.001) ? 1 : 0
Buy3 = SSA > SSB ? 1 : 0
Buy4 = sig > 20 ? 1 : 0
Buy4a = close - close[displacement] >=0.001 ? 1:0
Buy5 = Buy1 and Buy2 and Buy3 and Buy4 and Buy4a and not(Buy1[1] and Buy2[1] and Buy3[1])

//  1. Bear
Sell1 = (close <= min(SSAdisp, SSBdisp)) ? 1 : 0
Sell2 = (Kijun - Tenkan >= 0.001) ? 1 : 0
Sell3 = SSA < SSB ? 1 : 0
Sell4 = sig > 20 ? 1 : 0
Sell4a = close <= close[displacement]
Sell5 = Sell1 and Sell2 and Sell3 and Sell4 and Sell4a and not(Sell1[1] and Sell2[1] and Sell3[1])


// CONSOLIDATED

buysignal = Buy5
buyexitsignal = crossunder(close,Kijun)

sellsignal = Sell5
sellexitsignal = crossover(close,Kijun)

longCondition = buysignal
shortCondition = sellsignal

// Plot Indicators
// --------------------

// ----- Buy & Sell

//plotshape(longCondition, title = "Buy Signal", text ="BUY", textcolor =#FFFFFF , style=shape.labelup, size = size.tiny, location=location.belowbar, color = #1B8112, transp = 0)
//plotshape(shortCondition, title = "Short Signal", text ="SHORT", textcolor =#FFFFFF , style=shape.labeldown, size = size.tiny, location=location.abovebar, color = #000000, transp = 0)

// ----- Ichimoku Signals

//plotshape(Sell2, title = "Sell Signal", text ="Kumo Twist", textcolor =#FFFFFF , style=shape.labelup, size = size.tiny, location=location.top, color = color.black, transp = 0)
//plotshape(Sell3, title = "Sell Signal", text ="TK/KJ", textcolor =#FFFFFF , style=shape.labelup, size = size.tiny, location=location.bottom, color = color.black, transp = 0)

//plotshape(Buy4, title = "Buy Signal", text ="Kumo Twist", textcolor =#FFFFFF , style=shape.diamond, size = size.tiny, location=location.belowbar, color = color.blue, transp = 0)
//plotshape(Buy3, title = "Buy Signal", text ="TK/KJ", textcolor =#FFFFFF , style=shape.circle, size = size.tiny, location=location.abovebar, color = color.green, transp = 0)
//plotshape(Buy4, title = "Buy Signal", text ="TK/KJ", textcolor =#FFFFFF , style=shape.circle, size = size.tiny, location=location.belowbar, color = color.red, transp = 0)


//plotshape(buyexitsignal, title = "Buy Exit", style=shape.triangledown, size = size.tiny, location=location.abovebar, color = color.green, transp = 0)
//plotshape(sellexitsignal, title = "Buy Exit", style=shape.triangleup, size = size.tiny, location=location.belowbar, color = color.black, transp = 0)

//------------------------------
//------------------------------
// EXECUTION
//------------------------------
//------------------------------


// Test Range
// --------------------

// === INPUT BACKTEST RANGE ===
FromMonth = input(defval = 2, title = "From Month", minval = 1, maxval = 12)
FromDay   = input(defval = 1, title = "From Day", minval = 1, maxval = 31)
FromYear  = input(defval = 2015, title = "From Year", minval = 2017)
ToMonth   = input(defval = 1, title = "To Month", minval = 1, maxval = 12)
ToDay     = input(defval = 1, title = "To Day", minval = 1, maxval = 31)
ToYear    = input(defval = 9999, title = "To Year", minval = 2017)

// === FUNCTION EXAMPLE ===
start     = timestamp(FromYear, FromMonth, FromDay, 00, 00)  // backtest start window
finish    = timestamp(ToYear, ToMonth, ToDay, 23, 59)        // backtest finish window
window()  => true // create function "within window of time"

// Orders
// --------------------


if longCondition
    strategy.entry("Buy", strategy.long, when=window())

if buyexitsignal
    strategy.close("Buy")

if shortCondition
    strategy.entry("Sell", strategy.short, when=window())

if sellexitsignal
    strategy.close("Sell")