Stratégie de combinaison de moyenne mobile et de chandelier suivant la tendance
Aperçu
La stratégie combine les méthodes de la moyenne mobile pour déterminer la direction de la tendance et de la forme de la ligne K pour déterminer le point de retournement, pour réaliser des transactions de suivi de la tendance. La stratégie utilise d’abord la moyenne mobile pour déterminer la direction de la tendance globale, puis cherche dans la direction de la tendance une forme de ligne K potentiellement inversée comme signal d’entrée, afin de suivre la tendance.
Principe de stratégie
La stratégie utilise une moyenne mobile simple de 10 jours pour déterminer la direction de la tendance des prix. Quand les prix sont supérieurs à la moyenne mobile, ils sont considérés comme en tendance à la hausse; quand les prix sont inférieurs à la moyenne mobile, ils sont considérés comme en tendance à la baisse.
Après avoir déterminé la direction d’une tendance, la stratégie juge le point de retournement potentiel en fonction d’une série de formes de ligne K et de formes de ligne K négatives. Les formes de ligne négative courantes incluent l’étoile du lever, l’étoile du matin, les trois soldats blancs, etc. Les formes de ligne négative courantes incluent l’étoile du crépuscule, les trois corbeaux, etc.
En outre, la stratégie peut être combinée avec les principaux niveaux de résistance de soutien pour déterminer le prix d’entrée. Si vous achetez dans une tendance à la hausse, vous achetez lorsque vous franchissez le premier support.
Avantages stratégiques
Le plus grand avantage de cette stratégie est qu’elle combine à la fois un jugement de tendance et un signal de revers, ce qui lui permet de capturer en temps opportun les virages de tendance et de réaliser une opération de suivi de tendance. Comparée à une simple stratégie de moyenne mobile, cette stratégie peut considérablement augmenter la probabilité de gagner.
De plus, l’ajout de la forme K à la stratégie améliore également sa capacité à gérer les événements inattendus. La forme K peut jouer un rôle de filtrage et éviter les transactions erronées lorsque des événements de faible probabilité sur le marché entraînent de fausses percées.
Risque stratégique
Le principal risque de cette stratégie réside dans l’exactitude de la définition des paramètres des moyennes mobiles et de la détermination de la forme de la ligne K. Une mauvaise définition de la période des moyennes mobiles peut entraîner des erreurs de jugement de la tendance; une erreur de jugement de la forme de la ligne K peut également entraîner des erreurs de décision de négociation.
De plus, la forme de la ligne K inversée ne garantit pas une inversion de tendance à 100%, de sorte que la stratégie comporte un certain risque. Lorsque le marché subit une inversion de plus grande envergure, cela peut entraîner des pertes plus importantes pour la stratégie.
Direction d’optimisation
La stratégie a encore beaucoup de marge d’optimisation. Par exemple, il est possible de prendre en compte des paramètres d’ajustement dynamique des moyennes mobiles, en utilisant différentes périodes de moyennes mobiles à différents stades du marché. Il est également possible d’ajouter des méthodes d’apprentissage automatique, d’utiliser des données historiques pour former des modèles de jugement de forme de ligne K, afin d’améliorer l’exactitude des jugements.
En outre, il est possible d’envisager d’ajouter d’autres facteurs pour juger des tendances et des zones chaudes, telles que les variations du volume des transactions, les indicateurs de volatilité, etc., afin de rendre la stratégie plus complète et plus robuste.
Résumer
Cette stratégie est parfaitement adaptée pour suivre les tendances du marché boursier à moyen terme et peut générer des rendements stables élevés. Si elle est optimisée davantage, elle est susceptible de devenir une stratégie quantitative qui fonctionne bien. Si les investisseurs maîtrisent l’utilisation de la stratégie, ils peuvent également l’utiliser pour construire des portefeuilles à long terme afin de contrôler les risques individuels tout en obtenant de meilleurs rendements supplémentaires.
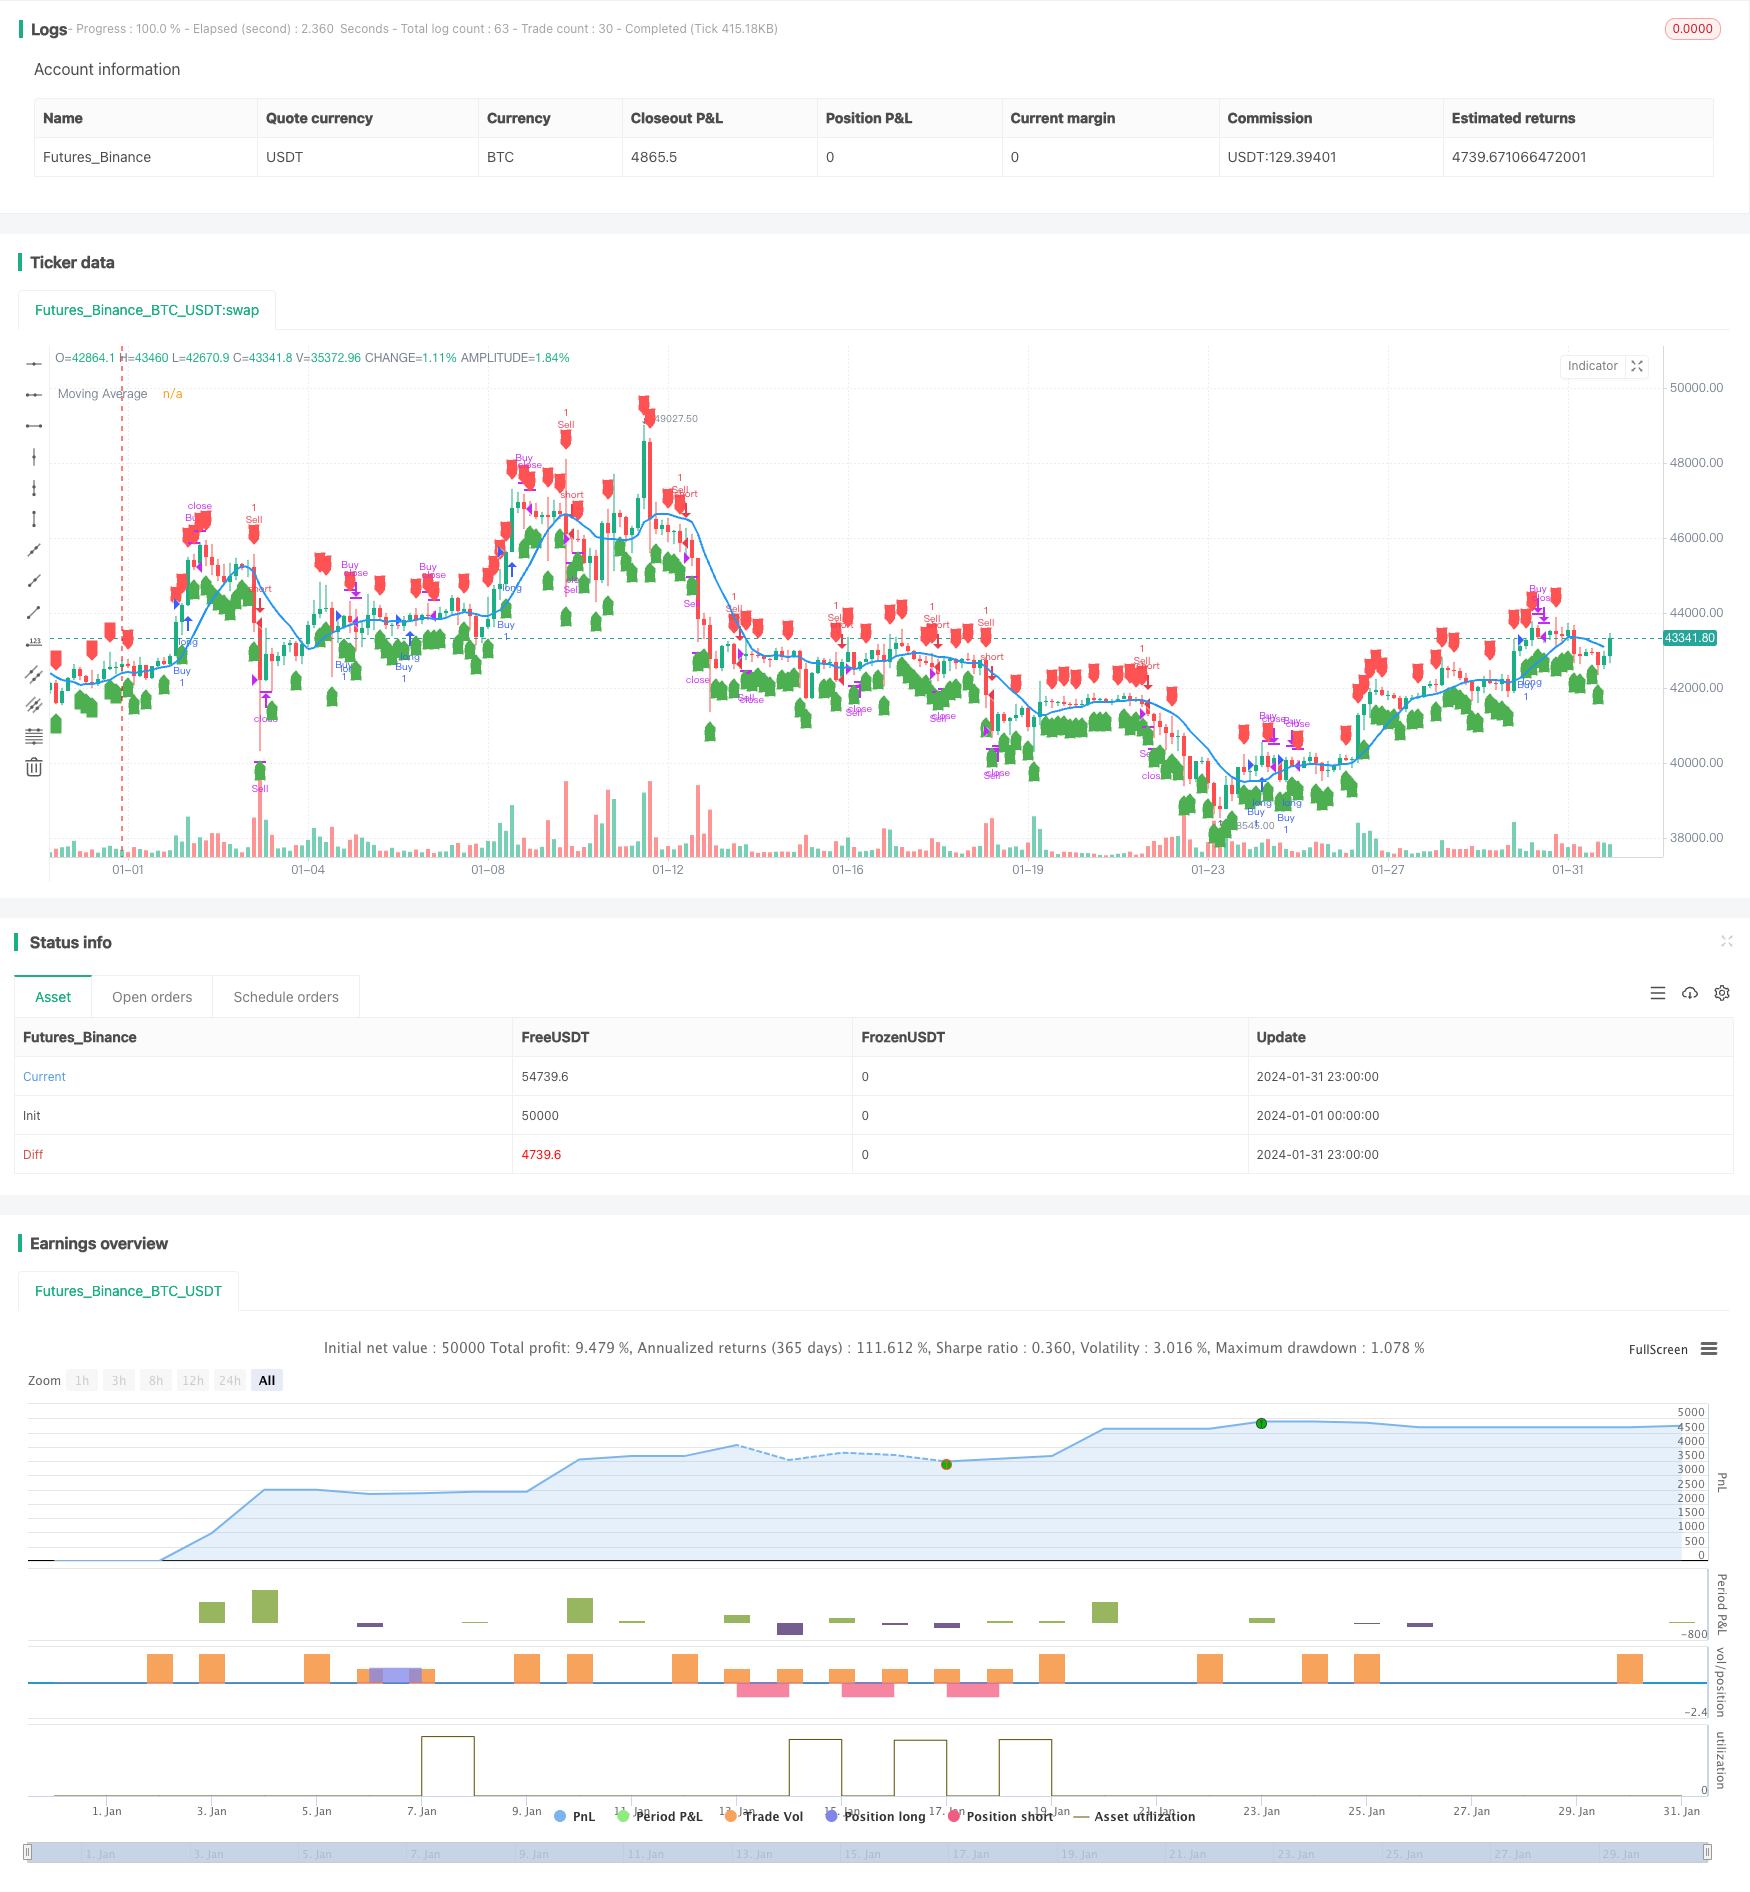
/*backtest
start: 2024-01-01 00:00:00
end: 2024-01-31 23:59:59
period: 3h
basePeriod: 15m
exchanges: [{"eid":"Futures_Binance","currency":"BTC_USDT"}]
*/

//@version=5
strategy("Trend Following Strategy with Candlestick Patterns", overlay=true)

// Moving Average
ma_period = input(10, title="Moving Average Period")
moving_average = ta.sma(close, ma_period)

// Candlestick Patterns
// Custom Function
abs(x) => x >= 0 ? x : -x

// Candlestick Patterns
isDoji() =>
    (close - open) <= (high - low) * 0.1

isMarubozuWhite() =>
    close == high and open == low and close > open

isHammer() =>
    (high - low) >= 3 * abs(open - close) and (close - low) / (0.001 + high - low) > 0.6 and (open - low) / (0.001 + high - low) > 0.6

isInvertedHammer() =>
    (high - low) >= 3 * abs(open - close) and (high - close) / (0.001 + high - low) > 0.6 and (high - open) / (0.001 + high - low) > 0.6

isLongLowerShadow() =>
    (low - close) > 2 * abs(open - close) and (low - open) / (0.001 + high - low) > 0.6

isUpsideTasukiGap() =>
    close[1] < open[1] and open > close and open > close[1] and close < open[1]

isRisingWindow() =>
    high[1] < low and close > open

isPiercing() =>
    close[1] < open[1] and close > open and close > ((open + low) / 2) and close < open[1] and open < close[1]

isBullishEngulfing() =>
    close[1] < open[1] and close > open and high > high[1] and low < low[1]

isTweezerBottom() =>
    low == ta.valuewhen(low == ta.lowest(low, 10), low, 0) and low == ta.valuewhen(low == ta.lowest(low, 20), low, 0)

isBullishAbandonedBaby() =>
    close[2] < open[2] and close[1] > open[1] and low[1] > ta.valuewhen(high == ta.highest(high, 2), high, 0) and open > close and close > ta.valuewhen(high == ta.highest(high, 2), high, 0)

isMorningStar() =>
    close[2] < open[2] and close[1] < open[1] and close > open[1] and open < close[2] and open > close[1]

isMorningDojiStar() =>
    close[2] < open[2] and close[1] < open[1] and isDoji() and close > open[1] and open < close[2] and open > close[1]

isDragonflyDoji() =>
    isDoji() and (high - close) / (0.001 + high - low) < 0.1 and (open - low) / (0.001 + high - low) > 0.6

isThreeWhiteSoldiers() =>
    close[2] < open[2] and close[1] < open[1] and close > open and open < close[2] and open < close[1] and close > open[1]

isRisingThreeMethods() =>
    close[4] < open[4] and close[1] < open[1] and close > open and open < close[4] and open < close[1] and close > open[1]

isMarubozuBlack() =>
    close == low and open == high and open > close

isGravestoneDoji() =>
    isDoji() and (close - low) / (0.001 + high - low) < 0.1 and (high - open) / (0.001 + high - low) > 0.6

isHangingMan() =>
    (high - low) >= 4 * abs(open - close) and (open - close) / (0.001 + high - low) > 0.6 and (high - open) / (0.001 + high - low) > 0.6

isLongUpperShadow() =>
    (high - open) > 2 * abs(open - close) and (high - close) / (0.001 + high - low) > 0.6

isDownsideTasukiGap() =>
    close[1] > open[1] and open < close and open < close[1] and close > open[1]

isFallingWindow() =>
    low[1] > high and close < open

isDarkCloudCover() =>
    close[1] > open[1] and close < open and close < ((open + high) / 2) and close > open[1] and open > close[1]

isBearishEngulfing() =>
    close[1] > open[1] and close < open and high > high[1] and low < low[1]

isTweezerTop() =>
    high == ta.valuewhen(high == ta.highest(high, 10), high, 0) and high == ta.valuewhen(high == ta.highest(high, 20), high, 0)

isAbandonedBaby() =>
    close[2] > open[2] and close[1] < open[1] and high[1] < ta.valuewhen(low == ta.lowest(low, 2), low, 0) and open < close and close < ta.valuewhen(low == ta.lowest(low, 2), low, 0)

isEveningDojiStar() =>
    close[2] > open[2] and close[1] > open[1] and isDoji() and close < open[1] and open > close[2] and open < close[1]

isEveningStar() =>
    close[2] > open[2] and close[1] > open[1] and close < open[1] and open > close[2] and open < close[1]

isThreeBlackCrows() =>
    close[2] > open[2] and close[1] > open[1] and close < open and open > close[2] and open > close[1] and close < open[1]

isFallingThreeMethods() =>
    close[4] > open[4] and close[1] > open

isShootingStar() =>
    (high - low) >= 3 * abs(open - close) and (high - close) / (0.001 + high - low) > 0.6 and (high - open) / (0.001 + high - low) > 0.6

doji = isDoji()
marubozuWhite = isMarubozuWhite()
hammer = isHammer()
invertedHammer = isInvertedHammer()
longLowerShadow = isLongLowerShadow()
upsideTasukiGap = isUpsideTasukiGap()
risingWindow = isRisingWindow()
piercing = isPiercing()
bullishEngulfing = isBullishEngulfing()
tweezerBottom = isTweezerBottom()
bullishAbandonedBaby = isBullishAbandonedBaby()
morningStar = isMorningStar()
morningDojiStar = isMorningDojiStar()
dragonflyDoji = isDragonflyDoji()
threeWhiteSoldiers = isThreeWhiteSoldiers()
risingThreeMethods = isRisingThreeMethods()
marubozuBlack = isMarubozuBlack()
gravestoneDoji = isGravestoneDoji()
hangingMan = isHangingMan()
longUpperShadow = isLongUpperShadow()
downsideTasukiGap = isDownsideTasukiGap()
fallingWindow = isFallingWindow()
darkCloudCover = isDarkCloudCover()
bearishEngulfing = isBearishEngulfing()
tweezerTop = isTweezerTop()
abandonedBaby = isAbandonedBaby()
eveningDojiStar = isEveningDojiStar()
eveningStar = isEveningStar()
threeBlackCrows = isThreeBlackCrows()
fallingThreeMethods = isFallingThreeMethods()
shootingStar = isShootingStar()
isBullishPattern() =>
    (isMarubozuWhite() or isHammer() or isInvertedHammer() or isDoji() or isMorningStar() or isBullishEngulfing() or isThreeWhiteSoldiers() or isMarubozuBlack() or isHangingMan() or isDownsideTasukiGap() or isDarkCloudCover())

isBearishPattern() =>
    (isMarubozuBlack() or isInvertedHammer() or isLongUpperShadow() or isTweezerTop() or isGravestoneDoji() or isEveningStar() or isBearishEngulfing() or isThreeBlackCrows() or isShootingStar())

isBullishCandle = isBullishPattern()
isBearishCandle = isBearishPattern()

// Calculate Pivot Points
pivotPoint(high, low, close) =>
    (high + low + close) / 3

r1 = pivotPoint(high[1], low[1], close[1]) * 2 - low[1]
s1 = pivotPoint(high[1], low[1], close[1]) * 2 - high[1]

r2 = pivotPoint(high[1], low[1], close[1]) + (high[1] - low[1])
s2 = pivotPoint(high[1], low[1], close[1]) - (high[1] - low[1])

r3 = high[1] + 2 * (pivotPoint(high[1], low[1], close[1]) - low[1])
s3 = low[1] - 2 * (high[1] - pivotPoint(high[1], low[1], close[1]))
// Trend Identification
is_uptrend = close > moving_average
is_downtrend = close < moving_average
// Entry and Exit Conditions with Trend Identification
enterLong = is_uptrend and isBullishCandle and close > r1
exitLong = is_uptrend and (bearishEngulfing or doji or close < s1)

enterShort = is_downtrend and isBearishCandle and close < s1
exitShort = is_downtrend and (bullishEngulfing or doji or close > r1)


// Strategy Execution
if enterLong and strategy.position_size == 0 and strategy.position_size[1] == 0 and close > r1
    strategy.entry("Buy", strategy.long, qty=1)

if exitLong and strategy.position_size > 0
    strategy.close("Buy")

if enterShort and strategy.position_size == 0 and close < s1
    strategy.entry("Sell", strategy.short, qty=1)

if exitShort and strategy.position_size < 0
    strategy.close("Sell")


// Stop-Loss and Trailing Stop-Loss
stop_loss_pct = input(2.0, title="Stop Loss Percentage")
trailing_stop_loss_pct = input(1.0, title="Trailing Stop Loss Percentage")
trailing_stop_loss_active = input(true, title="Trailing Stop Loss Active")

// Stop-Loss
stop_loss_level = strategy.position_avg_price * (1 - stop_loss_pct / 100)
strategy.exit("Stop Loss", "Buy", loss=stop_loss_level)

// Trailing Stop-Loss


// Plotting Moving Average
plot(moving_average, color=color.blue, title="Moving Average", linewidth=2)

// Plotting Candlestick Patterns
plotshape(isBullishCandle, title="Bullish Candle", location=location.belowbar, color=color.green, style=shape.labelup)
plotshape(isBearishCandle, title="Bearish Candle", location=location.abovebar, color=color.red, style=shape.labeldown)

// Plotting Support and Resistance Levels
//hline(r1, "Resistance Level 1", color=color.red, linestyle=hline.style_dotted)
//hline(s1, "Support Level 1", color=color.green, linestyle=hline.style_dotted)