Strategi Mengikuti Tren Momentum


Tanggal Pembuatan: 2023-11-07 16:49:49 Akhirnya memodifikasi: 2023-11-07 16:49:49
menyalin: 0 Jumlah klik: 650
1
fokus pada
1617
Pengikut

Strategi Mengikuti Tren Momentum

Ringkasan

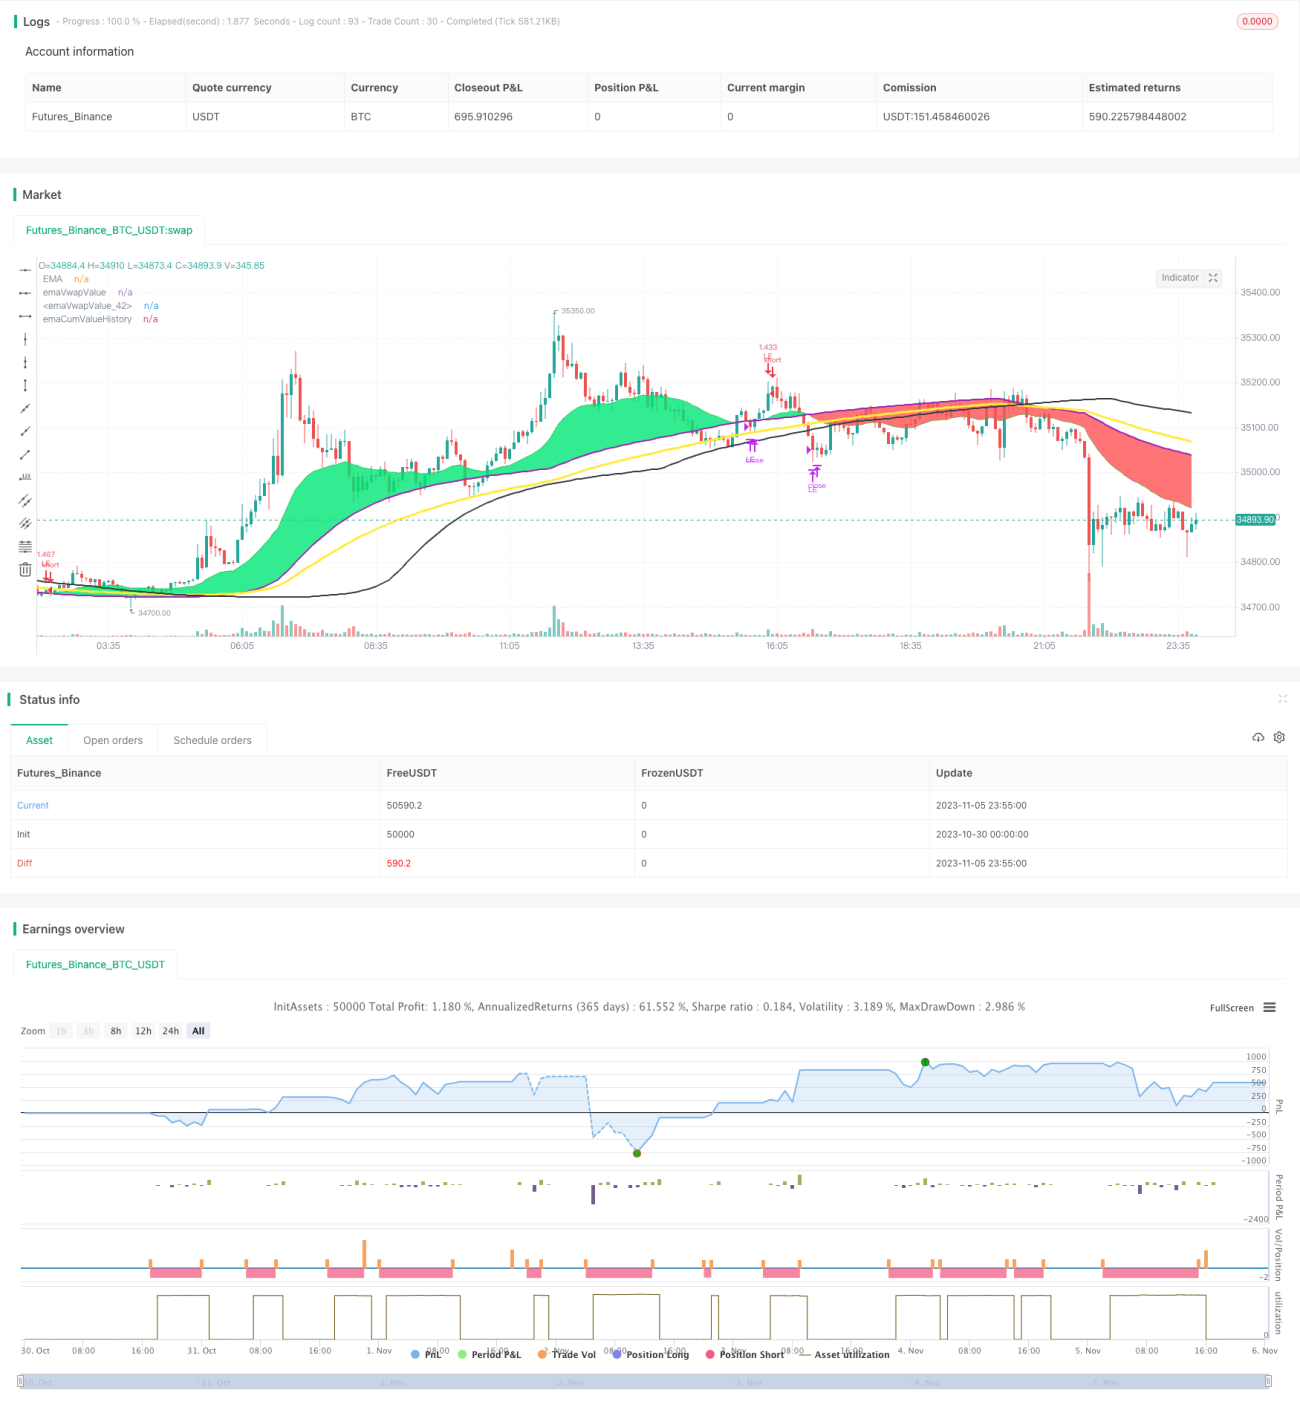
Strategi ini didasarkan pada analisis tren dari moving averages dan volume transaksi, menetapkan indikator momentum, dan melakukan perdagangan dengan cara yang mengikuti tren.

Prinsip Strategi

  1. Perhitungan rata-rata EMA harga tutup dan rata-rata EMA kumulatif volume transaksi
  2. Ketika close di atas EMA dinilai sebagai uptrend, lakukan multi-head operation
  3. Ketika terus naik, close di atas melewati 2 kali rata-rata EMA akumulasi, menambahkan posisi tambahan
  4. Setting RSI indicator, ketika RSI lebih dari 90 flattening 1 / 3 dari posisi yang menguntungkan
  5. Ketika close di bawah EMA, pertimbangkan untuk turun dan hapus semua posisi overhead
  6. Ketika close di bawah EMA dinilai sebagai tren menurun, lakukan operasi shorting
  7. Setting Stop Loss Line, Stop Loss Line adalah persentase tetap dari harga masuk
  8. Cara mendapatkan keuntungan dengan kepala kosong sama dengan dengan banyak kepala

Analisis Keunggulan

Strategi ini memiliki beberapa keuntungan:

  1. Menggunakan rata-rata EMA untuk menilai tren, dapat secara efektif melacak tren
  2. Menggunakan EMA kumulatif dari volume transaksi untuk menilai perubahan tren yang sebenarnya
  3. Mengikuti RSI untuk mendapatkan keuntungan
  4. Pengendalian risiko, batas kerugian
  5. Parameter yang dapat disesuaikan dengan situasi yang berbeda dan dapat disesuaikan secara fleksibel

Analisis risiko

Risiko utama dari strategi ini adalah:

  1. EMA rata-rata terbelakang, mungkin kehilangan titik balik
  2. Jumlah transaksi tidak selalu mencerminkan tren yang sebenarnya.
  3. Stop loss persentase tetap mungkin terlalu mekanis
  4. PARAMETERS terlalu banyak, sulit untuk disesuaikan
  5. Transaksi yang sering dan biaya transaksi yang tinggi

Ide-ide untuk mengatasi risiko:

  1. Optimalkan parameter EMA untuk mengurangi keterlambatan
  2. Sinyal konfirmasi volume transaksi dikombinasikan dengan indikator lainnya
  3. Optimalkan Stop Loss Berdasarkan Kondisi Pasar
  4. Parameter disederhanakan, hanya menjaga pengaturan utama
  5. Lini Stop Loss dan Frekuensi Perdagangan yang Sesuai

Arah optimasi

Strategi ini dapat dioptimalkan dalam beberapa hal:

  1. Uji berbagai pengaturan parameter EMA untuk menemukan kombinasi parameter optimal
  2. Meningkatkan perkalian volume untuk menentukan kekuatan sinyal masuk
  3. Digabungkan dengan MACD, KD dan lain-lain untuk konfirmasi masuk
  4. Persentase Stop Loss Optimisasi Berdasarkan Karakteristik Saham Khusus
  5. Optimalkan frekuensi transaksi dan kurangi biaya transaksi

Meringkaskan

Strategi ini secara keseluruhan adalah strategi pelacakan tren yang didasarkan pada sistem garis rata. Gagasan utamanya adalah menggunakan EMA untuk menentukan arah tren, dan bekerja dengan indikator dinamika VOLUME untuk mengkonfirmasi masuk. Dapat terus dioptimalkan melalui pengoptimalan parameter, dan membantu indikator lain untuk mengkonfirmasi lebih lanjut. Secara keseluruhan adalah strategi pelacakan tren yang fleksibel, yang dapat memperoleh hasil yang baik setelah operasi yang mahir.

Kode Sumber Strategi
/*backtest
start: 2023-10-30 00:00:00
end: 2023-11-06 00:00:00
period: 5m
basePeriod: 1m
exchanges: [{"eid":"Futures_Binance","currency":"BTC_USDT"}]
*/

// This source code is subject to the terms of the Mozilla Public License 2.0 at https://mozilla.org/MPL/2.0/
// © mohanee

//@version=4
strategy("EMA_cumulativeVolume_crossover[Strategy]", overlay=true, pyramiding=5, default_qty_type=strategy.percent_of_equity,  default_qty_value=20, initial_capital=10000)


emaLength= input(25, title="EMA Length", minval=1, maxval=200)
cumulativePeriod = input(100,  title="cumulative volume Period", minval=1, maxval=200)


riskCapital = input(title="Risk % of capital", defval=10, minval=1)
stopLoss=input(8,title="Stop Loss",minval=1)
takePartialProfits=input(true, title="take partial profits  (percentage same as stop loss)")

tradeDirection=input(title="Trade Direction", defval="LONG", options=["LONG", "SHORT"])

avgPrice = (high + low + close) / 3
avgPriceVolume = avgPrice * volume

cumulPriceVolume = sum(avgPriceVolume, cumulativePeriod)
cumulVolume = sum(volume, cumulativePeriod)

cumValue = cumulPriceVolume / cumulVolume

emaVal=ema(close, emaLength)

emaCumValue1=ema(cumValue, emaLength)
emaCumValue2=ema(cumValue, emaLength*2)

emaCumValueHistory=ema(cumValue[emaLength], emaLength)


//vwapVal1=vwap(hlc3)

rsiVal=rsi(close,5)

plotEma=plot(emaVal, title="EMA", color=color.green,  transp=25)
//plot(vwapValue, title="Cumulate Volumne", color=color.orange,  linewidth=2, transp=25)
//plot(vwapVal1, title="vwapVal1", color=color.purple,  linewidth=1, transp=25)
plotCum=plot(emaCumValue1, title="emaVwapValue", color=color.purple,  linewidth=2, transp=35)
plot(emaCumValue2, title="emaVwapValue", color=color.yellow,  linewidth=3, transp=25)
fill(plotEma,plotCum, color=emaVal>emaCumValue1 ? color.lime : color.red, transp=35, title="ema and cum area")

plot(emaCumValueHistory, title="emaCumValueHistory", color=color.black,  linewidth=2, transp=25)


//bgcolor(emaVal>vwapValue?color.blue:color.purple)    

//Entry--
//Echeck how many units can be purchased based on risk manage ment and stop loss
qty1 = (strategy.equity  * riskCapital / 100 ) /  (close*stopLoss/100)  

//check if cash is sufficient  to buy qty1  , if capital not available use the available capital only
qty1:= (qty1 * close >= strategy.equity ) ? (strategy.equity / close) : qty1

//strategy.entry(id="LE",comment="LE", long=true, qty=qty1, when=crossover(emaVal, vwapValue)  and (tradeDirection=="LONG") )    //emaVal>vwapValue and crossover(close , emaVal)

strategy.entry(id="LE",comment="LE", long=true, qty=qty1, when=strategy.position_size==0 and crossover(emaVal, emaCumValue1)  and (tradeDirection=="LONG") )    //emaVal>vwapValue and crossover(close , emaVal)

//re-entry
rentryCondition1=strategy.position_size>1 and emaVal > emaCumValue1 and emaCumValue1>emaCumValue2 and crossover(close, emaCumValue2) and close>open and  (tradeDirection=="LONG")
strategy.entry(id="LE",comment="LE RE", long=true, qty=qty1, when=rentryCondition1 )

rentryCondition2=strategy.position_size>1 and emaVal > emaCumValue1 and emaCumValue1>emaCumValueHistory and crossover(close, emaCumValueHistory) and close>open and  (tradeDirection=="LONG")
//strategy.entry(id="LE",comment="LE RE", long=true, qty=qty1, when=rentryCondition2 )    


//stoploss
stopLossVal=  strategy.position_size>=1 ?  (strategy.position_avg_price * (1-(stopLoss*0.01) )) : 0.00

//draw initil stop loss
//plot(strategy.position_size>=1 ? stopLossVal : na, color = color.purple , style=plot.style_linebr,  linewidth = 2, title = "stop loss")

//partial exits
takeProfit=  strategy.position_size>=1 ?  (strategy.position_avg_price * (1+(1*0.01) )) : ( close[1] * 2 )
//if(takePartialProfits==true)
    //strategy.close(id="LE", comment="Partial"+tostring(close-strategy.position_avg_price, "###.##") , qty=strategy.position_size/3 , when = (tradeDirection=="LONG" ) and close>takeProfit and crossunder(close, emaVal) )    //close<close[1] and close[1]<close[2] and close[2]<close[3])

strategy.close(id="LE", comment="PExit Points=>"+tostring(close-strategy.position_avg_price, "###.##") , qty=strategy.position_size/3 , when = (tradeDirection=="LONG" ) and  takePartialProfits == true and close>=takeProfit and crossunder(rsiVal,90) )

profitVal=    strategy.position_size>=1 ?  (strategy.position_avg_price * (1+(1*0.01) )) : ( close[1] * 2 )

//strategy.close(id="LE" , comment="LE Exit Points="+tostring(close-strategy.position_avg_price, "###.##"), when=crossunder(emaVal, vwapValue) and (tradeDirection=="LONG") )

strategy.close(id="LE" , comment="Exit Points=>"+tostring(close-strategy.position_avg_price, "###.##"), when=  crossunder(emaVal, emaCumValue1) and (tradeDirection=="LONG") )


strategy.close(id="LE" , comment="SL Exit Loss="+tostring(close-strategy.position_avg_price, "###.##"), when= close < stopLossVal   and (tradeDirection=="LONG") )


//for short  you dont have to wait crossodown of ema, falling is speed , so just check if close crossing down vwapVal
strategy.entry(id="SE",comment="SE", long=false, qty=qty1, when=crossunder(emaVal, emaCumValue1) and (tradeDirection=="SHORT") )    //emaVal>vwapValue and crossover(close , emaVal)


//stoploss
stopLossValUpside=  abs(strategy.position_size)>=1 and tradeDirection=="SHORT" ?  (strategy.position_avg_price * (1+(stopLoss*0.01) )) : 0.00

//draw initil stop loss
//plot(abs(strategy.position_size)>=1 and tradeDirection=="SHORT" ? stopLossValUpside : na, color = color.purple , style=plot.style_linebr,  linewidth = 2, title = "stop loss")

//partial exits
shortTakeProfit=  abs(strategy.position_size)>=1 and tradeDirection=="SHORT" ?  (strategy.position_avg_price * (1-(stopLoss*0.01) )) : 0.00
if(takePartialProfits==true)
    strategy.close(id="SE", comment="Partial" , qty=strategy.position_size/3 , when = (tradeDirection=="SHORT"   ) and  crossover(rsiVal,15) )  //close<takeProfit and (emaVal - close)>8 )
  
//strategy.close(id="SE" , comment="SE Exit Points="+tostring(close-strategy.position_avg_price, "###.##"), when=crossover(emaVal, vwapValue) and (tradeDirection=="SHORT") )
//strategy.close(id="SE" , comment="SE Exit Points="+tostring(close-strategy.position_avg_price, "###.##"), when= abs(strategy.position_size)>=1 and ( (emaVal<emaCumValue1 and close>emaCumValue1 and open>emaCumValue1 and close>open )   or (crossover(emaVal,emaCumValue1))  ) and (tradeDirection=="SHORT") )

//strategy.close(id="SE" , comment="SL Exit Loss="+tostring(close-strategy.position_avg_price, "###.##"), when= abs(strategy.position_size)>=1 and  close > stopLossValUpside   and (tradeDirection=="SHORT"   ) )
strategy.close(id="SE" , comment="SL Exit Loss="+tostring(close-strategy.position_avg_price, "###.##"), when= abs(strategy.position_size)>=1 and  crossover(emaVal, emaCumValue1)   and (tradeDirection=="SHORT"   ) )