Strategi perdagangan jangka pendek tren turun

Ringkasan
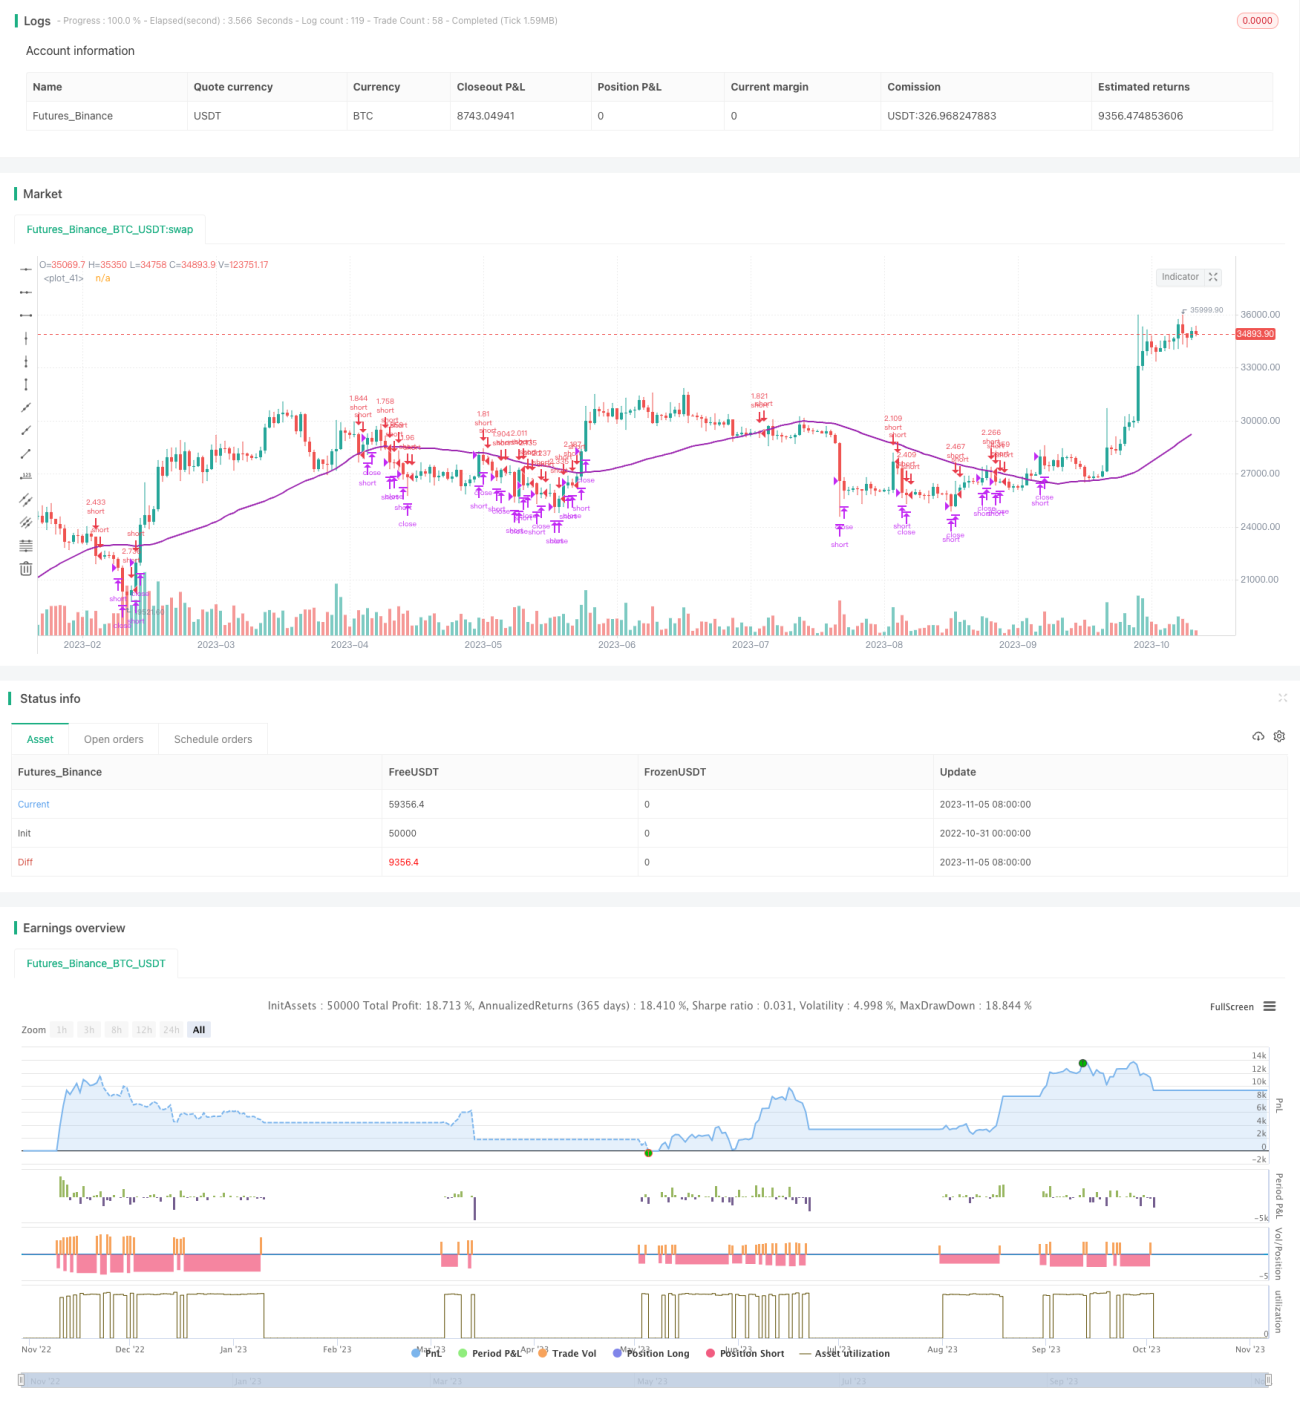
Strategi ini menggunakan moving averages dan indikator yang relatif kuat untuk menentukan arah tren pasar, untuk secara bertahap membangun posisi pendek dalam tren turun dan menghasilkan keuntungan.
Prinsip Strategi
Ketika harga close out di bawah 100 hari Simple Moving Average dan RSI lebih besar dari 30, bukalah entry. Kemudian atur stop loss dan stop loss, stop loss lebih dari 3% dari harga masuk dan stop loss di bawah 2% dari harga masuk. Dengan demikian, Anda mendapatkan ruang stop loss yang lebih besar untuk mentolerir pergerakan pasar.
Pada platform Coinrule, Anda dapat mengatur urutan pesanan jual beberapa kali untuk membangun posisi secara bertahap. Ketika pasar terus turun, Anda dapat meningkatkan posisi secara bertahap.
Strategi ini menghubungkan stop loss dan stop loss untuk setiap transaksi. Rasio stop loss dan stop loss dioptimalkan untuk mata uang yang berada di posisi terdepan. Anda dapat melakukan penyesuaian sesuai dengan mata uang tertentu.
Stop loss adalah 3% dari harga masuk
Stop loss 2% dari harga masuk
Sedikit lebih besar dari stop loss rasio dapat mentolerir fluktuasi yang lebih besar dan menghindari stop loss yang tidak perlu.
Analisis Keunggulan
- Menggunakan Moving Average untuk menentukan arah tren pasar, Anda dapat menangkap tren turun tepat waktu
- Filter indikator yang relatif lemah dapat menghindari blanko buta
- Peningkatan posisi secara bertahap dapat meminimalkan risiko dan mendapatkan rasio risiko / imbalan yang lebih baik
- Setting Stop Loss Stop Loss memastikan bahwa setiap transaksi dapat ditanggung
Analisis risiko
- Jika terjadi pergeseran V, kemungkinan kerugian yang lebih besar
- "Kami akan terus memantau situasi dan melakukan penyesuaian pada harga stop loss.
- Perlu kontrol yang masuk akal terhadap skala posisi, tidak perlu terlalu banyak memanfaatkan
- Strategi ini dapat ditangguhkan untuk menghindari kerugian yang tidak perlu dalam situasi gempa besar.
Arah optimasi
- Indikator rata-rata bergerak yang dapat diuji dengan parameter yang berbeda
- Kombinasi indikator RSI yang dapat diuji dengan parameter yang berbeda
- Anda dapat menyesuaikan Stop Loss Stop Loss Ratio untuk mengoptimalkan Rasio Risiko-Rugi
- Anda dapat melakukan pengujian pada interval waktu yang berbeda untuk mengontrol ukuran posisi.
Meringkaskan
Strategi ini didasarkan pada arah tren yang ditentukan oleh rata-rata bergerak, filter indikator RSI menentukan waktu masuk tertentu, dan dapat secara efektif menangkap tren penurunan. Metode penambahan saham secara bertahap dapat mengontrol risiko, dan pengaturan stop loss memastikan kemampuan perdagangan tunggal.
- 1