
Strategi ini menggunakan mekanisme dua jalur untuk menentukan arah tren pasar, yang bekerja sama dengan sinyal silang rata-rata untuk masuk ke pasar. Secara khusus, strategi ini menggunakan rata-rata dari periode yang berbeda untuk membangun dua jalur untuk menentukan tren, dengan harga menerobos naik atau turun; kemudian menggabungkan sinyal silang rata-rata yang cepat dan lambat untuk menyaring masuk ke pasar.
Strategi penyeberangan linier yang menembus dua jalur terdiri dari beberapa bagian utama:
Modul penilaian tren: menggunakan garis rata-rata periode yang berbeda untuk membangun dua jalur, harga menerobos jalur atas untuk menilai tren naik, dan menerobos jalur bawah untuk menilai tren turun.
Modul masuk: cepat rata-rata di garis tengah panjang rata-rata di garis tengah lebih banyak, di bawah memakai kosong. Pada saat yang sama perlu untuk menilai arah tren.
Modul Keluar: cepat rata-rata di bawah garis melewati garis tengah panjang rata-rata ketika posisi kosong.
Strategi pertama menggunakan parameter Trend Required untuk mengatur kekuatan tren yang perlu dihakimi. Ketika harga menembus jalur atas atau bawah, penilaian sebagai tren terbentuk. Setelah itu, ketika melewati garis rata-rata panjang dan menengah di garis rata-rata cepat, masuk lebih banyak; ketika melewati garis rata-rata panjang dan menengah di bawah garis rata-rata cepat, masuk kosong. Setelah masuk, melewati garis rata-rata panjang dan menengah di bawah garis rata-rata cepat sebagai sinyal keluar.
Selain itu, strategi ini juga dilengkapi dengan modul stop loss dan stop loss. Parameter spesifik dapat disesuaikan dan dioptimalkan untuk mengontrol risiko dan keuntungan.
Dibandingkan dengan strategi single track atau single average line, strategi cross-breaking cross-average dual track menggabungkan penilaian tren dan pilihan waktu masuk, sehingga dapat lebih memahami irama pasar. Kelebihan spesifiknya adalah:
Pengaturan dual-track memungkinkan penilaian tren yang lebih akurat dan menghindari kehilangan peluang.
Filter lintas rata dapat mengurangi probabilitas terobosan palsu melakukan operasi berlawanan arah.
Pengaturan parameter dapat dilakukan untuk mengoptimalkan risiko dan keuntungan
Strategi logisnya sederhana, jelas, mudah dipahami, dan mudah dilacak.
Strategi penyeberangan linier dua jalur juga memiliki beberapa risiko, terutama dalam hal:
Pengaturan dua arah tidak sepenuhnya menghindari kemungkinan kesalahan penilaian tren.
Pengaturan yang salah terhadap parameter garis rata-rata dapat menyebabkan frekuensi transaksi yang terlalu tinggi atau operasi terbalik.
Stop loss setup terlalu longgar untuk mengontrol kerugian tunggal secara efektif.
Solusi yang sesuai adalah sebagai berikut:
Sesuaikan parameter dua jalur, dan bebaskan pertimbangan untuk penembusan.
Mengoptimalkan portofolio siklus rata-rata untuk memastikan frekuensi perdagangan yang wajar.
Uji berbagai tingkat stop loss untuk menemukan parameter optimal.
Strategi penyeberangan linier dua jalur ini juga dapat dioptimalkan dengan beberapa cara:
Uji berbagai parameter periodik rata-rata untuk menemukan kombinasi optimal.
Mencoba menambahkan lebih banyak garis rata, membangun sistem penyaringan multi-garis rata.
Pengujian berbagai algoritma stop loss, seperti tracking stop loss, shock stop loss, dan lain-lain.
Bergabung dengan mekanisme pengembalian dana untuk mengoptimalkan efisiensi penggunaan dana.
Filtrasi dilakukan dengan kombinasi indikator lain, seperti pita Brin, KDJ, dan lain sebagainya.
Strategi lintas linier lintas linier lintas linier lintas linier mencakup penilaian tren dan pilihan waktu masuk, yang dapat secara efektif menangkap irama pasar. Strategi ini memiliki penilaian yang lebih akurat dan penyaringan yang lebih baik dibandingkan dengan indikator tunggal. Dengan optimasi parameter dan peningkatan modul, stabilitas dan tingkat pengembalian strategi diharapkan dapat ditingkatkan lebih lanjut.
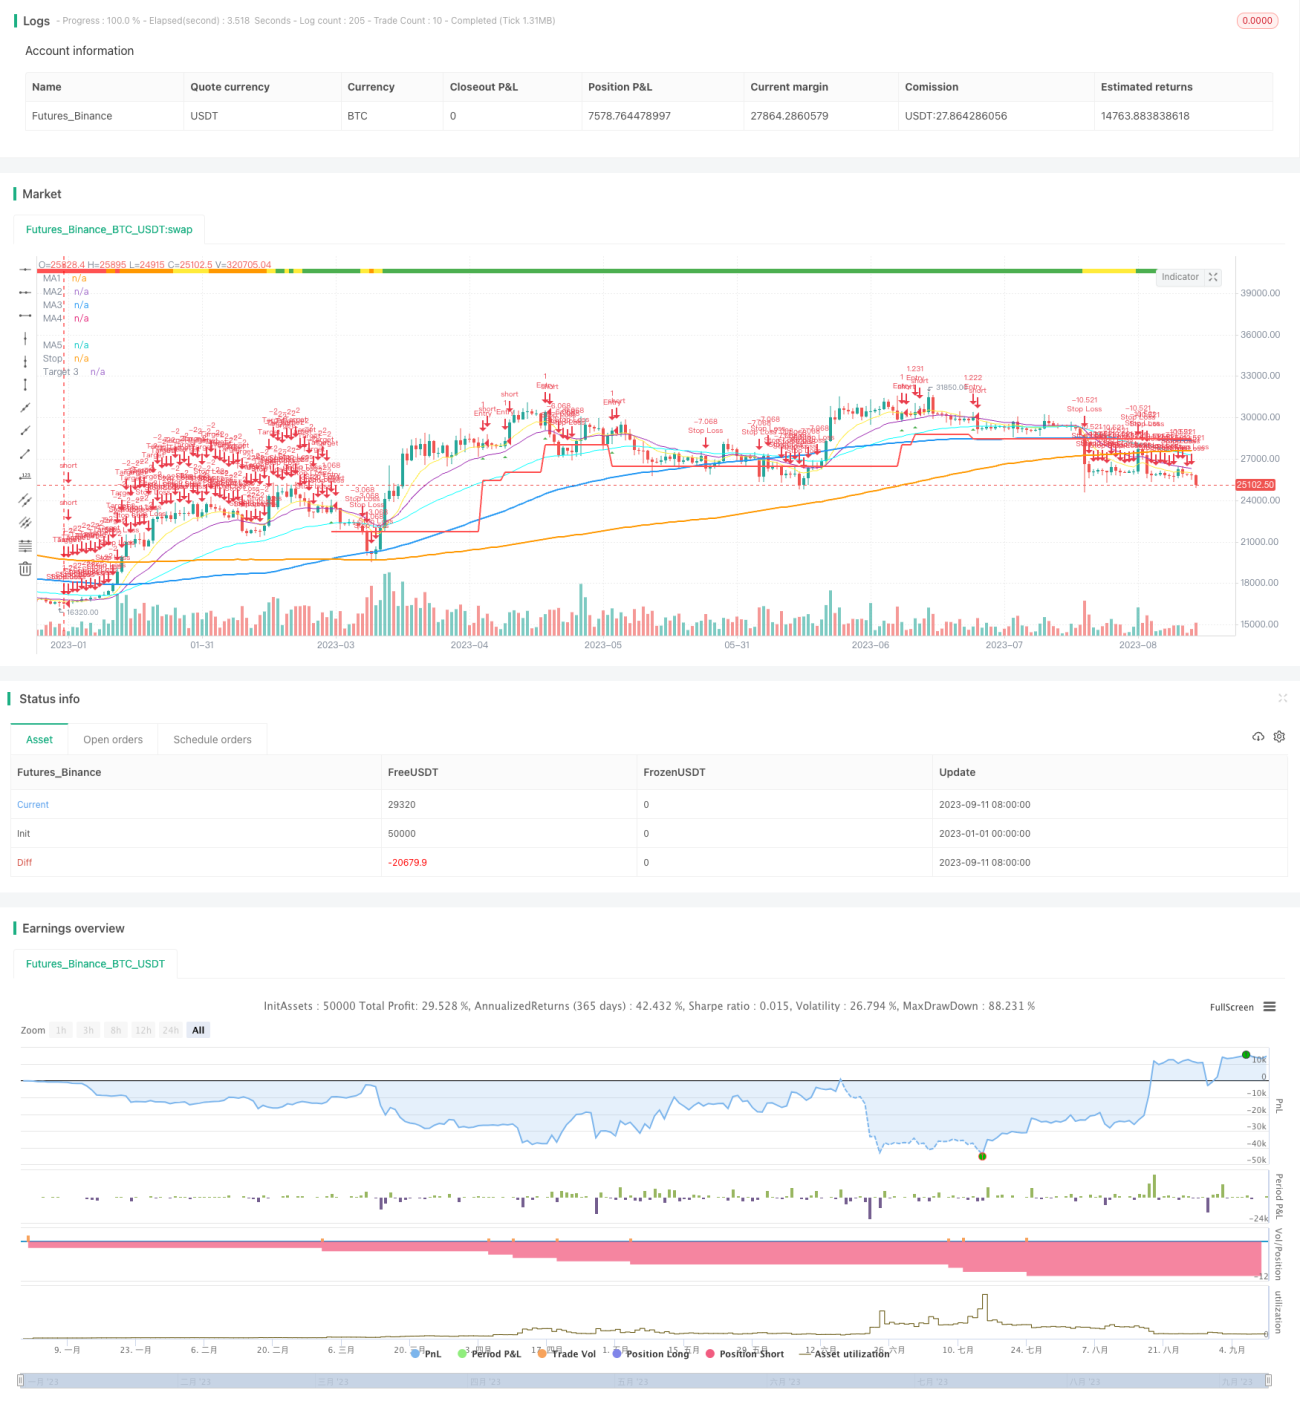
/*backtest
start: 2023-01-01 00:00:00
end: 2023-09-12 00:00:00
period: 1d
basePeriod: 1h
exchanges: [{"eid":"Futures_Binance","currency":"BTC_USDT"}]
*/
//@version=4
//Author = Dustin Drummond https://www.tradingview.com/u/Dustin_D_RLT/
//Strategy based in part on original 10ema Basic Swing Trade Strategy by Matt Delong: https://www.tradingview.com/u/MattDeLong/
//Link to original 10ema Basic Swing Trade Strategy: https://www.tradingview.com/script/8yhGnGCM-10ema-Basic-Swing-Trade-Strategy/
//This is the Original EMAC - Exponential Moving Average Cross Strategy built as a class for reallifetrading dot com and so has all the default settings and has not been optimized
//I would not recomend using this strategy with the default settings and is for educational purposes only
//For the fully optimized version please come back around the same time tomorrow 6/16/21 for the EMAC - Exponential Moving Average Cross - Optimized
//EMAC - Exponential Moving Average Cross
strategy(title="EMAC - Exponential Moving Average Cross", shorttitle = "EMAC", overlay = true, calc_on_every_tick=false, default_qty_value = 100, initial_capital = 100000, default_qty_type = strategy.fixed, pyramiding = 0, process_orders_on_close=true)
//creates a time filter to prevent "too many orders error" and allows user to see Strategy results per year by changing input in settings in Stratey Tester
startYear = input(2015, title="Start Year", minval=1980, step=1)
timeFilter = (year >= startYear) and (month >= 1) and (dayofmonth >= 1)
//R Size (Risk Amount)
rStaticOrPercent = input(title="R Static or Percent", defval="Static", options=["Static", "Percent"])
rSizeStatic = input(2000, title="R Size Static", minval=1, step=100)
rSizePercent = input(3, title="R Size Percent", minval=.01, step=.01)
rSize = rStaticOrPercent == "Static" ? rSizeStatic : rStaticOrPercent == "Percent" ? (rSizePercent * .01 * strategy.equity) : 1
//Recent Trend Indicator "See the standalone version for detailed description"
res = input(title="Trend Timeframe", type=input.resolution, defval="W")
trend = input(26, minval=1, title="# of Bars for Trend")
trendMult = input(15, minval=0, title="Trend Growth %", step=.25) / 100
currentClose = security(syminfo.tickerid, res, close)
pastClose = security(syminfo.tickerid, res, close[trend])
//Trend Indicator
upTrend = (currentClose >= (pastClose * (1 + trendMult)))
downTrend = (currentClose <= (pastClose * (1 - trendMult)))
sidewaysUpTrend = (currentClose < (pastClose * (1 + trendMult)) and (currentClose > pastClose))
sidewaysDownTrend = (currentClose > (pastClose * (1 - trendMult)) and (currentClose < pastClose))
//Plot Trend on Chart
plotshape(upTrend, "Up Trend", style=shape.square, location=location.top, color=color.green, size=size.small)
plotshape(downTrend, "Down Trend", style=shape.square, location=location.top, color=color.red, size=size.small)
plotshape(sidewaysUpTrend, "Sideways Up Trend", style=shape.square, location=location.top, color=color.yellow, size=size.small)
plotshape(sidewaysDownTrend, "Sideways Down Trend", style=shape.square, location=location.top, color=color.orange, size=size.small)
//What trend signals to use in entrySignal
trendRequired = input(title="Trend Required", defval="Orange", options=["Green", "Yellow", "Orange", "Red"])
goTrend = trendRequired == "Orange" ? upTrend or sidewaysUpTrend or sidewaysDownTrend : trendRequired == "Yellow" ? upTrend or sidewaysUpTrend : trendRequired == "Green" ? upTrend : trendRequired == "Red" ? upTrend or sidewaysUpTrend or sidewaysDownTrend or downTrend : na
//MAs Inputs Defalt is 10 EMA, 20 EMA, 50 EMA, 100 SMA and 200 SMA
ma1Length = input(10, title="MA1 Period", minval=1, step=1)
ma1Type = input(title="MA1 Type", defval="EMA", options=["SMA", "EMA", "WMA"])
ma2Length = input(20, title="MA2 Period", minval=1, step=1)
ma2Type = input(title="MA2 Type", defval="EMA", options=["SMA", "EMA", "WMA"])
ma3Length = input(50, title="MA3 Period", minval=1, step=1)
ma3Type = input(title="MA3 Type", defval="EMA", options=["SMA", "EMA", "WMA"])
ma4Length = input(100, title="MA4 Period", minval=1, step=1)
ma4Type = input(title="MA4 Type", defval="SMA", options=["SMA", "EMA", "WMA"])
ma5Length = input(200, title="MA5 Period", minval=1, step=1)
ma5Type = input(title="MA5 Type", defval="SMA", options=["SMA", "EMA", "WMA"])
//MAs defined
ma1 = ma1Type == "EMA" ? ema(close, ma1Length) : ma1Type == "SMA" ? sma(close, ma1Length) : wma(close, ma1Length)
ma2 = ma2Type == "EMA" ? ema(close, ma2Length) : ma2Type == "SMA" ? sma(close, ma2Length) : wma(close, ma2Length)
ma3 = ma3Type == "EMA" ? ema(close, ma3Length) : ma3Type == "SMA" ? sma(close, ma3Length) : wma(close, ma3Length)
ma4 = ma4Type == "SMA" ? sma(close, ma4Length) : ma4Type == "EMA" ? ema(close, ma4Length) : wma(close, ma4Length)
ma5 = ma5Type == "SMA" ? sma(close, ma5Length) : ma5Type == "EMA" ? ema(close, ma5Length) : wma(close, ma5Length)
//Plot MAs
plot(ma1, title="MA1", color=color.yellow, linewidth=1, style=plot.style_line)
plot(ma2, title="MA2", color=color.purple, linewidth=1, style=plot.style_line)
plot(ma3, title="MA3", color=#00FFFF, linewidth=1, style=plot.style_line)
plot(ma4, title="MA4", color=color.blue, linewidth=2, style=plot.style_line)
plot(ma5, title="MA5", color=color.orange, linewidth=2, style=plot.style_line)
//Allows user to toggle on/off ma1 > ma2 filter
enableShortMAs = input(title="Enable Short MA Cross Filter", defval="Yes", options=["Yes", "No"])
shortMACross = enableShortMAs == "Yes" and ma1 > ma2 or enableShortMAs == "No"
//Allows user to toggle on/off ma4 > ma5 filter
enableLongMAs = input(title="Enable Long MA Cross Filter", defval="Yes", options=["Yes", "No"])
longMACross = enableLongMAs == "Yes" and ma4 >= ma5 or enableLongMAs == "No"
//Entry Signals
entrySignal = (strategy.position_size <= 0 and close[1] < ma1[1] and close > ma1 and close > ma2 and close > ma3 and shortMACross and ma1 > ma3 and longMACross and goTrend)
secondSignal = (strategy.position_size > 0 and close[1] < ma1[1] and close > ma1 and close > ma2 and close > ma3 and shortMACross and ma1 > ma3 and longMACross and goTrend)
plotshape(entrySignal, style=shape.triangleup, location=location.belowbar, color=color.green, size=size.small)
plotshape(secondSignal, style=shape.triangleup, location=location.belowbar, color=color.lime, size=size.small)
//ATR for Stops
atrValue = (atr(14))
//to test ATR enable next line
//plot(atrValue, linewidth=1, color=color.black, style=plot.style_line)
atrMult = input(2.5, minval=.25, step=.25, title="Stop ATR Multiple")
//Only target3Mult is used in current strategy target1 and target2 might be used in the future with pyramiding
//target1Mult = input(1.0, minval=.25, step=.25, title="Targert 1 Multiple")
//target2Mult = input(2.0, minval=.25, step=.25, title="Targert 2 Multiple")
target3Mult = input(3.0, minval=.25, step=.25, title="Target Multiple")
enableAtrStop = input(title="Enable ATR Stops", defval="Yes", options=["Yes", "No"])
//Intitial Recomended Stop Location
atrStop = entrySignal and ((high - (atrMult * atrValue)) < low) ? (high - (atrMult * atrValue)) : low
//oneAtrStop is used for testing only enable next 2 lines to test
//oneAtrStop = entrySignal ? (high - atrValue) : na
//plot(oneAtrStop, "One ATR Stop", linewidth=2, color=color.orange, style=plot.style_linebr)
initialStop = entrySignal and enableAtrStop == "Yes" ? atrStop : entrySignal ? low : na
//Stops changed to stoploss to hold value for orders the next line is old code "bug"
//plot(initialStop, "Initial Stop", linewidth=2, color=color.red, style=plot.style_linebr)
//Set Initial Stop and hold value "debug code"
stoploss = valuewhen(entrySignal, initialStop, 0)
plot(stoploss, title="Stop", linewidth=2, color=color.red)
enableStops = input(title="Enable Stops", defval="Yes", options=["Yes", "No"])
yesStops = enableStops == "Yes" ? 1 : enableStops == "No" ? 0 : na
//Calculate size of trade based on R Size
//Original buggy code:
//positionSize = (rSize/(close - initialStop))
//Added a minimum order size of 1 "debug code"
positionSize = (rSize/(close - initialStop)) > 1 ? (rSize/(close - initialStop)) : 1
//Targets
//Enable or Disable Targets
enableTargets = input(title="Enable Targets", defval="Yes", options=["Yes", "No"])
yesTargets = enableTargets == "Yes" ? 1 : enableTargets == "No" ? 0 : na
//Only target3 is used in current strategy target1 and target2 might be used in the future with pyramiding
//target1 = entrySignal ? (close + ((close - initialStop) * target1Mult)) : na
//target2 = entrySignal ? (close + ((close - initialStop) * target2Mult)) : na
target3 = entrySignal ? (close + ((close - initialStop) * target3Mult)) : na
//plot(target1, "Target 1", linewidth=2, color=color.green, style=plot.style_linebr)
//plot(target2, "Target 2", linewidth=2, color=color.green, style=plot.style_linebr)
plot(target3, "Target 3", linewidth=2, color=color.green, style=plot.style_linebr)
//Set Target and hold value "debug code"
t3 = valuewhen(entrySignal, target3, 0)
//To test t3 and see plot enable next line
//plot(t3, title="Target", linewidth=2, color=color.green)
//MA1 Cross Exit
enableEarlyExit = input(title="Enable Early Exit", defval="Yes", options=["Yes", "No"])
earlyExit = enableEarlyExit == "Yes" ? 1 : enableEarlyExit == "No" ? 0 : na
ma1CrossExit = strategy.position_size > 0 and close < ma1
//Entry Order
strategy.order("Entry", long = true, qty = positionSize, when = (strategy.position_size <= 0 and entrySignal and timeFilter))
//Early Exit Order
strategy.close_all(when = ma1CrossExit and timeFilter and earlyExit, comment = "MA1 Cross Exit")
//Stop and Target Orders
//strategy.cancel orders are needed to prevent bug with Early Exit Order
strategy.order("Stop Loss", false, qty = strategy.position_size, stop=stoploss, oca_name="Exit",when = timeFilter and yesStops, comment = "Stop Loss")
strategy.cancel("Stop Loss", when = ma1CrossExit and timeFilter and earlyExit)
strategy.order("Target", false, qty = strategy.position_size, limit=t3, oca_name="Exit", when = timeFilter and yesTargets, comment = "Target")
strategy.cancel("Target", when = ma1CrossExit and timeFilter and earlyExit)