Strategi perdagangan mengikuti tren berdasarkan regresi linier dan rata-rata pergerakan

Ringkasan
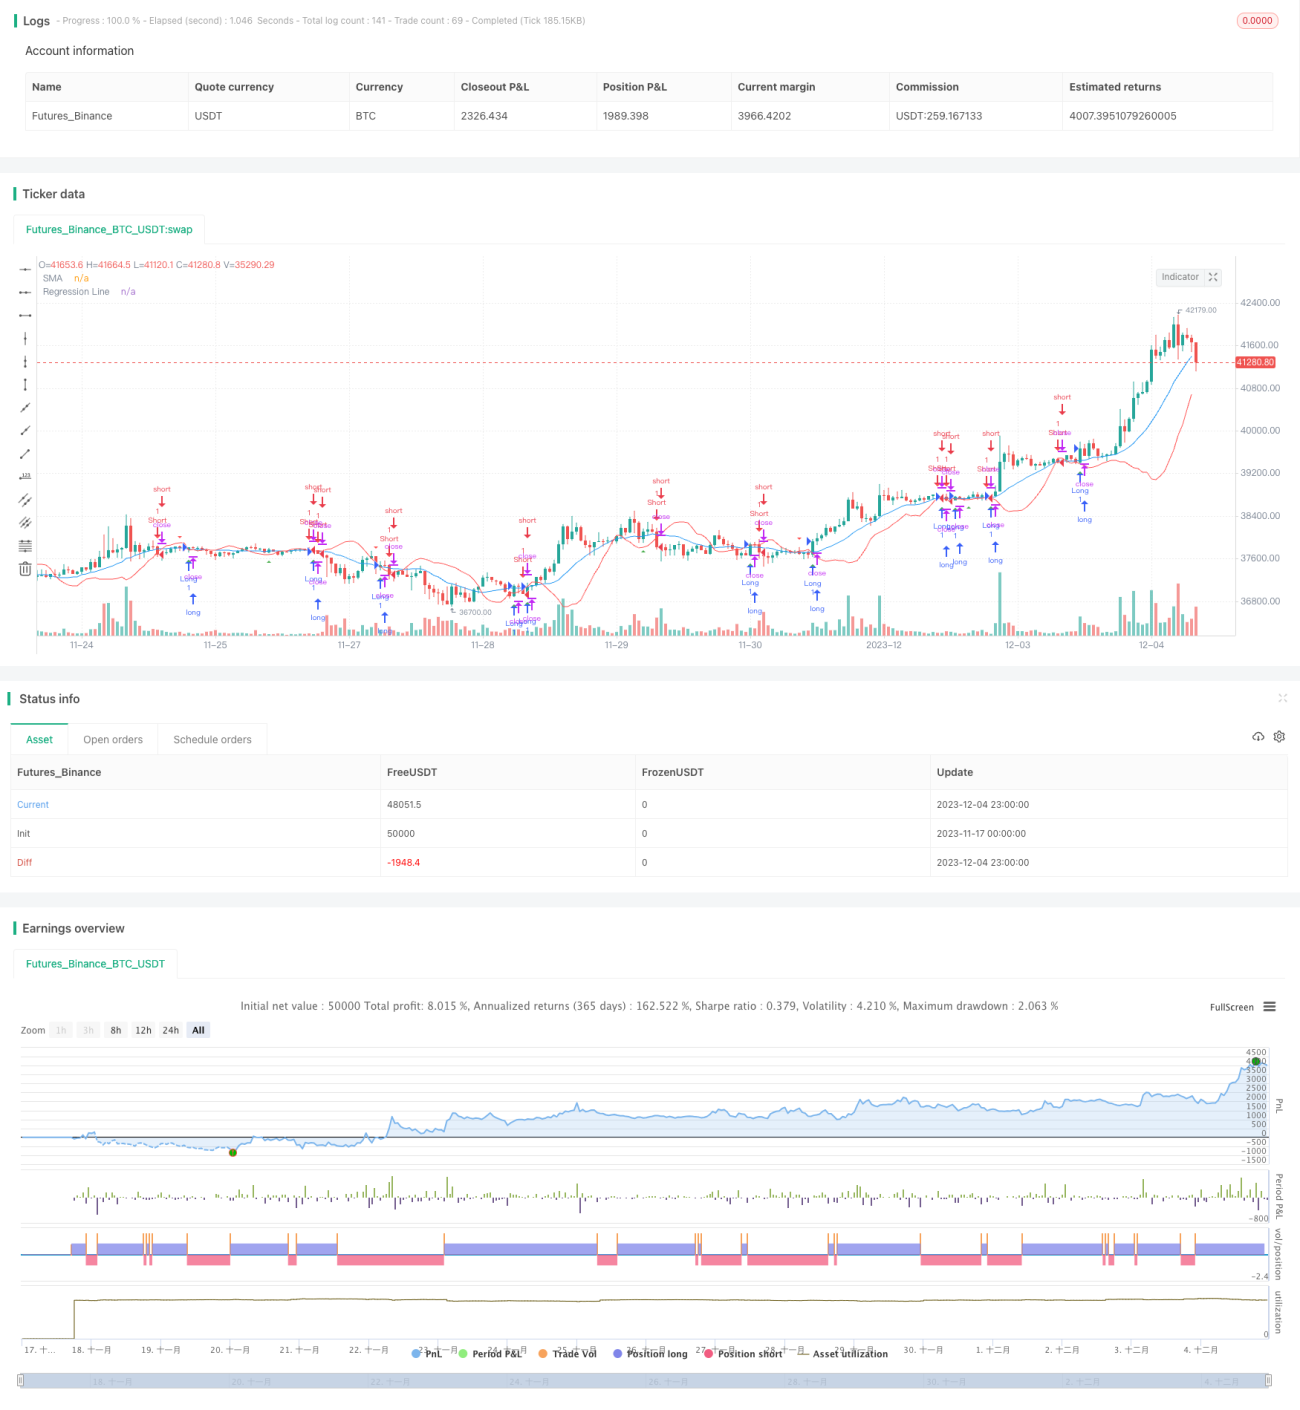
Strategi ini didasarkan pada garis regresi linier dan rata-rata bergerak yang dirancang sebagai sistem perdagangan pelacakan tren sederhana. Di atas garis regresi linier, Anda melakukan lebih banyak ketika Anda melewati rata-rata bergerak, dan di bawah garis regresi linier, Anda melakukan lebih sedikit ketika Anda melewati rata-rata bergerak.
Nama kebijakan
Trend Following Regression Trading Strategy (Strategi Perdagangan Regresi Mengikuti Tren)
Prinsip Strategi
Strategi ini mencakup beberapa bagian penting:
- Hitung rata-rata bergerak sederhana (SMA) N hari
- Hitung garis regresi linear untuk N hari terakhir
- Ketika harga close out melewati garis SMA dan lebih tinggi dari garis regresi, lakukan lebih banyak
- Ketika harga close out menembus SMA dan berada di bawah garis regresi, lakukan shorting
- Tetapkan harga stop loss dan stop loss
Garis regresi linier sangat cocok dengan arah tren dalam beberapa waktu terakhir. Ini dapat digunakan untuk membantu menentukan arah tren keseluruhan. Ketika harga menembus garis SMA, kita perlu menilai lebih lanjut apakah arah garis regresi linier sesuai dengan penembusan tersebut.
Selain itu, strategi ini juga mengatur mekanisme stop loss. Ketika harga menyentuh garis stop loss, posisi kosong berhenti. Juga mengatur garis stop loss, mengunci sebagian keuntungan.
Keunggulan Strategis
Strategi ini memiliki keuntungan sebagai berikut:
- Kombinasi indikator tren dan indikator terobosan, menghindari terobosan palsu, meningkatkan kualitas sinyal
- Menggunakan regresi linier untuk menentukan arah tren, melakukan penyaringan tren, hanya melakukan lebih banyak ketika tren naik, dan melakukan blanko ketika tren turun
- Pengaturan Stop Loss dan Stop Stop Mechanism untuk Mengontrol Risiko
- Peraturan yang jelas, mudah dipahami dan diterapkan
- Hanya perlu menyesuaikan beberapa parameter, tidak terlalu rumit
Analisis risiko
Strategi ini juga memiliki beberapa risiko:
- Lebih banyak sinyal perdagangan yang salah dalam situasi yang bergejolak
- Pengaturan rata-rata bergerak dan siklus regresi membutuhkan pengoptimalan pengujian berulang, dan pengaturan yang salah dapat mempengaruhi kinerja strategi
- Kecelakaan yang terjadi pada kondisi ekstrim dapat menyebabkan kerugian yang lebih besar.
- Berdasarkan Indikator Teknis saja, Tidak Tergabung dengan Faktor Fundamental
Untuk mengatasi risiko ini, kita dapat mengoptimalkan beberapa hal berikut:
- Pertimbangkan strategi penundaan atau filter dengan indikator lain di pasar yang bergoyang
- Periksa ulang parameter untuk menemukan parameter yang optimal
- Optimasi dan penyesuaian posisi stop loss secara dinamis
- Faktor-faktor mendasar seperti data ekonomi
Arah optimasi
Strategi ini dapat dioptimalkan dengan cara:
- Menambahkan indikator tambahan untuk menilai kondisi pasar dan menghindari perdagangan di tengah kondisi yang tidak stabil
- Mengoptimalkan jenis rata-rata bergerak, seperti kombinasi rata-rata bergerak ganda, rata-rata bergerak tiga
- Analisis lebih lanjut pada kemiringan garis regresi, menambahkan aturan penilaian kemiringan
- Kombinasi dengan indikator volatilitas, pengaturan posisi stop loss stop loss dinamis
- Mengoptimalkan parameter secara otomatis menggunakan metode pembelajaran mesin
Meringkaskan
Strategi ini mengintegrasikan fungsi trend tracking dari moving averages dengan fungsi trend judgement dari linear regression, membentuk sebuah sistem trading trend tracking yang relatif sederhana dan mudah dilakukan. Dalam pasar yang jelas trend, strategi ini dapat memperoleh efek yang lebih baik.
- 1