Strategi Perdagangan Deviasi Volatilitas SMA

Strategi Perdagangan Deviasi Volatilitas SMA
Tinjauan Strategi
Strategi ini menggunakan rata-rata bergerak sederhana dan beberapa perhitungan matematika untuk menentukan titik beli/jual. Kami menggunakan 100 hari SMA sebagai garis dasar. Jika harga tutup berada di bawah garis, kami memilih titik buka berdasarkan seberapa jauh di bawah garis, nilai ini (<<<<<<<<<<<<<<<<<<<<<<<<<<<<<<<<<<<<<<<<<<<<<<<<<<<<<<<<<<<<<<<<<<<<<<<<<<<<<<<<<<<<<<<<<<<<<<<<<<<<<<<<<<<<<<<<<<<<<<<<<<<<<<<<<<<<<<<<<<<<<<<<<<<<<<<<<<<<<<<<<<<<<<<<<<<<<<<<<<<<<<<<<<<<<<<<<<<<<<<<<<<
Prinsip Strategi
Strategi ini menggunakan tiga garis SMA: garis cepat (default 14 hari), garis lambat (default 100 hari), dan garis referensi (default 30 hari).
Ketika harga close-out berada di bawah garis referensi, dan bias rendah dari garis lambat relatif lebih besar dari bias rendah yang dikonfigurasi, dan garis cepat naik dan garis lambat turun, masuk ke dalam multipel. Ketika kondisi ini terpenuhi, garis cepat dan lambat sangat mungkin untuk bersilang, sehingga merupakan titik masuk yang lebih baik.
Ketika harga close out lebih tinggi dari garis referensi, dan perpindahan tinggi garis lambat relatif lebih besar dari perpindahan tinggi yang dikonfigurasi, dan harga close out telah naik 3 garis K berturut-turut, telah mencapai keuntungan, dan garis cepat lebih tinggi dari garis lambat, posisi kosong lebih sederhana. Jika harga terus naik, stop loss akan dimulai.
Posisi yang masuk pada setiap transaksi berdasarkan proporsi hak dan kepentingan tertentu, dengan cara ini mengendalikan posisi.
Analisis Keunggulan Strategi
- Mengambil keuntungan dari SMA, yaitu meratakan kurva harga, memfilter kebisingan pasar.
- SMA cross memiliki kemampuan untuk memprediksi tren.
- Untuk menghindari false breakout, setelkan deflection terhadap garis SMA.
- Dengan kombinasi dari tren dan cross-index, ini meningkatkan akurasi pengambilan keputusan.
- Menggunakan Tracking Stop Loss untuk mengunci keuntungan dan menghindari penarikan.
Analisis Risiko Strategi
- SMA sendiri memiliki keterbelakangan yang kuat dan mungkin akan melewatkan titik balik harga.
- Pengaturan bias yang tidak tepat dapat menyebabkan terlalu radikal atau terlalu berhati-hati.
- Pengaturan parameter tracking stop loss yang salah dapat menyebabkan stop loss yang terlalu cepat atau terlalu besar.
- Tidak mampu menghadapi pasar yang bergejolak.
Langkah-langkah optimasi yang sesuai:
- Filter masuk dalam kombinasi dengan indikator sebelumnya lainnya.
- Optimalisasi pengujian berulang pada defleksinya.
- Parameter stop loss diuji berulang kali untuk menemukan parameter optimal.
- Menurunkan posisi pada fase fluktuasi tinggi.
Arah optimasi strategi
- Mencari parameter optimal untuk menguji SMA pada periode yang berbeda
- Menambahkan indikator lain untuk menilai struktur dan tren pasar
- Optimalkan parameter tracking stop loss untuk mengunci lebih banyak keuntungan
- Mengubah posisi sesuai dengan volatilitas pasar
- Pada saat yang sama diterapkan pada berbagai varietas dan dalam kombinasi
Meringkaskan
Strategi perdagangan SMA yang bergeser secara bergelombang mencari waktu masuk yang optimal dengan menetapkan pergerakan yang mengacu pada rata-rata SMA yang berbeda. Pada saat yang sama, mekanisme keluar diatur untuk melacak stop loss untuk mengunci keuntungan. Strategi ini sederhana dan mudah dipahami dan mudah diterapkan.
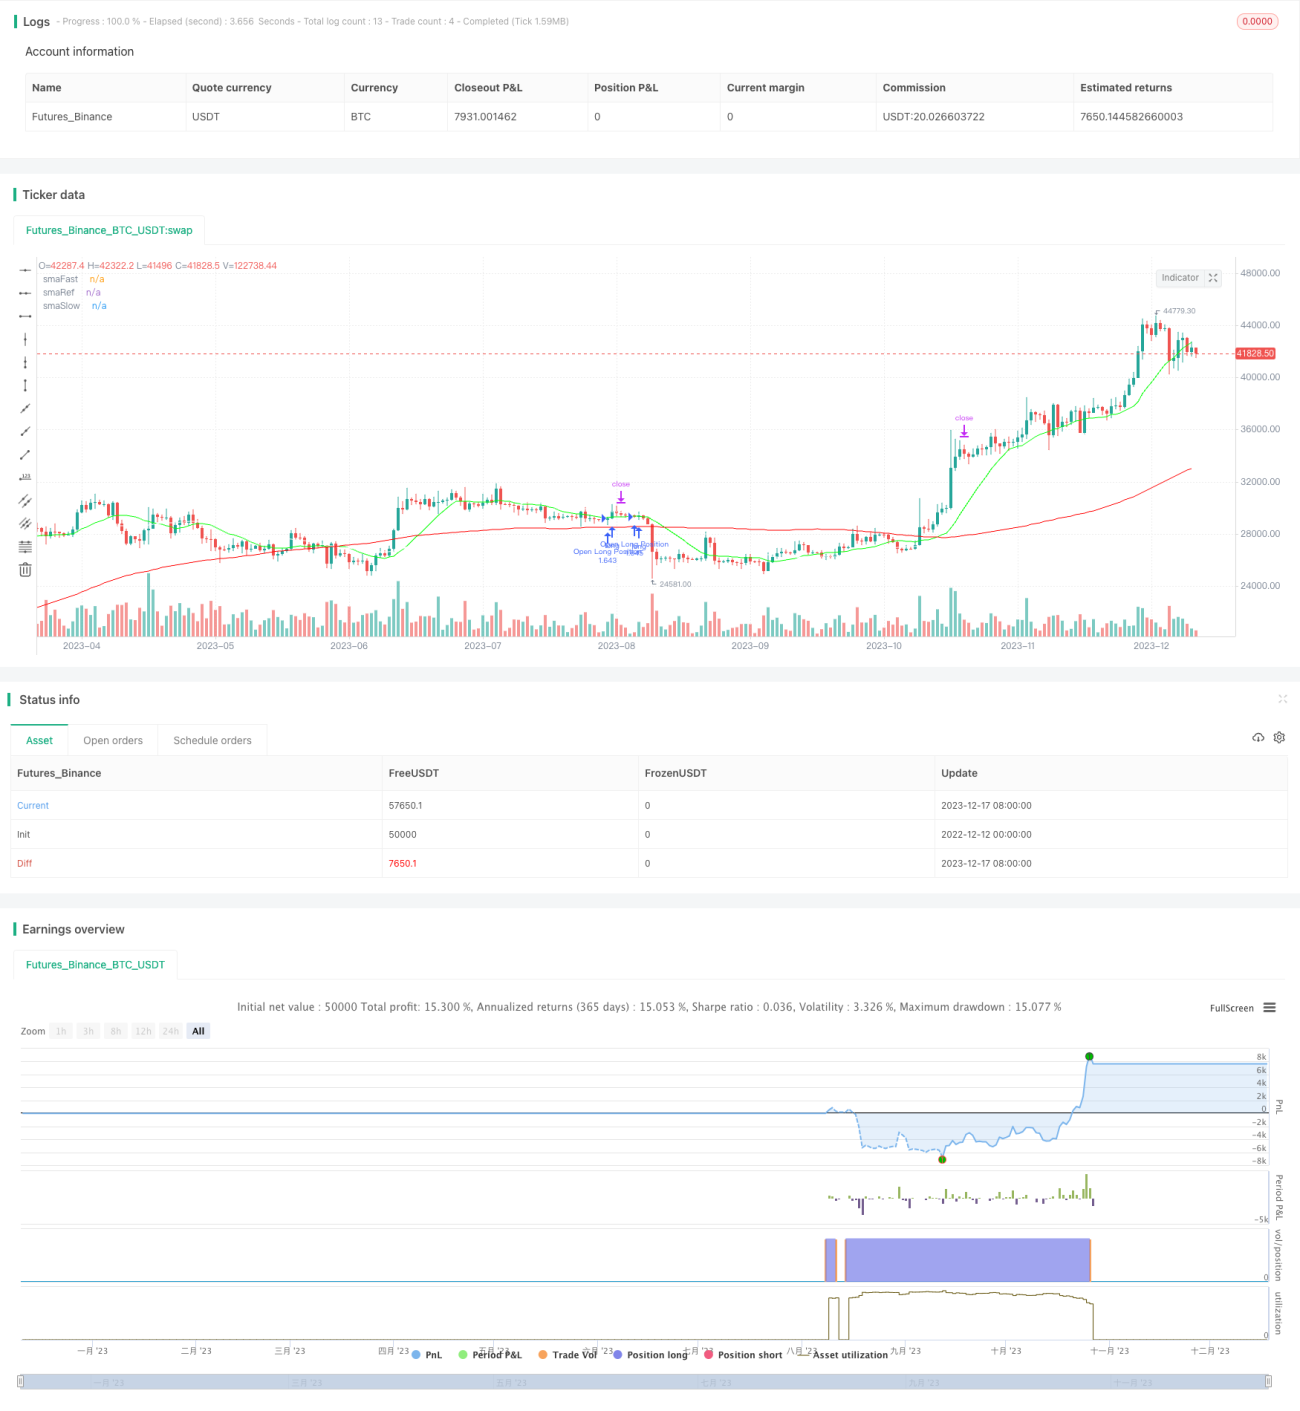
/*backtest
start: 2022-12-12 00:00:00
end: 2023-12-18 00:00:00
period: 1d
basePeriod: 1h
exchanges: [{"eid":"Futures_Binance","currency":"BTC_USDT"}]
*/

// @version=4
// Author: Sonny Parlin (highschool dropout)
strategy(shorttitle="SMA+Strategy", title="SMA Offset Strategy",
overlay=true, currency=currency.USD,- 1