Strategi Mengikuti Tren Rata-rata Bergerak Tiga Dinamis
Ringkasan
Strategi pelacakan tren tren tiga rata-rata dinamis menggunakan rata-rata bergerak bergerak yang dinamis untuk beberapa periode waktu untuk mengidentifikasi tren pasar, dan memungkinkan penyaringan konsistensi tren antara periode waktu yang berbeda, sehingga meningkatkan keandalan sinyal perdagangan.
Prinsip Strategi
Strategi ini menggunakan tiga set parameter yang berbeda untuk meluruskan rata-rata bergerak secara dinamis. Rata-rata bergerak pertama menghitung arah tren harga periode saat ini, rata-rata bergerak kedua menghitung arah tren harga periode waktu yang lebih tinggi, dan rata-rata bergerak ketiga menghitung arah tren harga periode waktu yang lebih tinggi.
Moving average menggunakan fungsi smoothing dinamis yang dapat secara otomatis menghitung dan menerapkan faktor smoothing yang tepat antara periode waktu yang berbeda, sehingga rata-rata bergerak periode waktu yang tinggi pada grafik periode waktu yang rendah menunjukkan garis tren yang lancar, bukan garis yang bengkok. Dengan smoothing dinamis ini, strategi dapat menentukan arah tren keseluruhan pada periode waktu yang tinggi, sementara juga dapat melakukan eksekusi perdagangan pada periode waktu yang rendah, untuk mencapai pelacakan tren yang efisien.
Keunggulan Strategis
Keuntungan terbesar dari strategi ini adalah mekanisme penyaringan tren dalam beberapa frame waktu. Dengan menghitung arah tren rata-rata harga untuk periode waktu yang berbeda, dan meminta konsistensi antara periode yang berbeda, Anda dapat secara efektif menyaring gangguan sinyal perdagangan dari gelombang harga jangka pendek, memastikan bahwa setiap sinyal perdagangan berada dalam tren besar, sehingga meningkatkan probabilitas keuntungan secara signifikan.
Kelebihan lain adalah penggunaan fungsi smoothing dinamis. Ini memungkinkan strategi untuk mengidentifikasi tren keseluruhan pada periode waktu tinggi dan titik perdagangan tertentu pada periode waktu rendah. Strategi dapat menentukan arah tren besar pada periode waktu tinggi dan melakukan perdagangan tertentu pada periode waktu rendah.
Risiko dan optimasi
Risiko utama dari strategi ini adalah kurangnya sinyal perdagangan. Kondisi penyaringan tren yang ketat akan mengurangi jumlah peluang perdagangan, yang mungkin tidak terlalu cocok untuk beberapa investor yang mengejar perdagangan frekuensi tinggi.
Selain itu, pengaturan parameter juga memerlukan pengujian dan pengoptimalan yang cermat, terutama panjang siklus rata-rata bergerak. Pasar yang berbeda memerlukan pengaturan parameter siklus yang berbeda untuk mendapatkan hasil yang optimal. Kombinasi parameter yang optimal dapat ditemukan dengan pengujian ulang.
Optimisasi di masa depan juga dapat mempertimbangkan untuk menambahkan lebih banyak indikator teknis untuk penyaringan, atau menambahkan algoritma pembelajaran mesin untuk mengoptimalkan parameter otomatis.
Meringkaskan
Strategi ini secara keseluruhan merupakan strategi pelacakan tren yang sangat praktis. Mekanisme pemfilteran tren multi-frame memberikan dukungan arah yang baik untuk setiap keputusan perdagangan, secara efektif mengurangi risiko perdagangan.
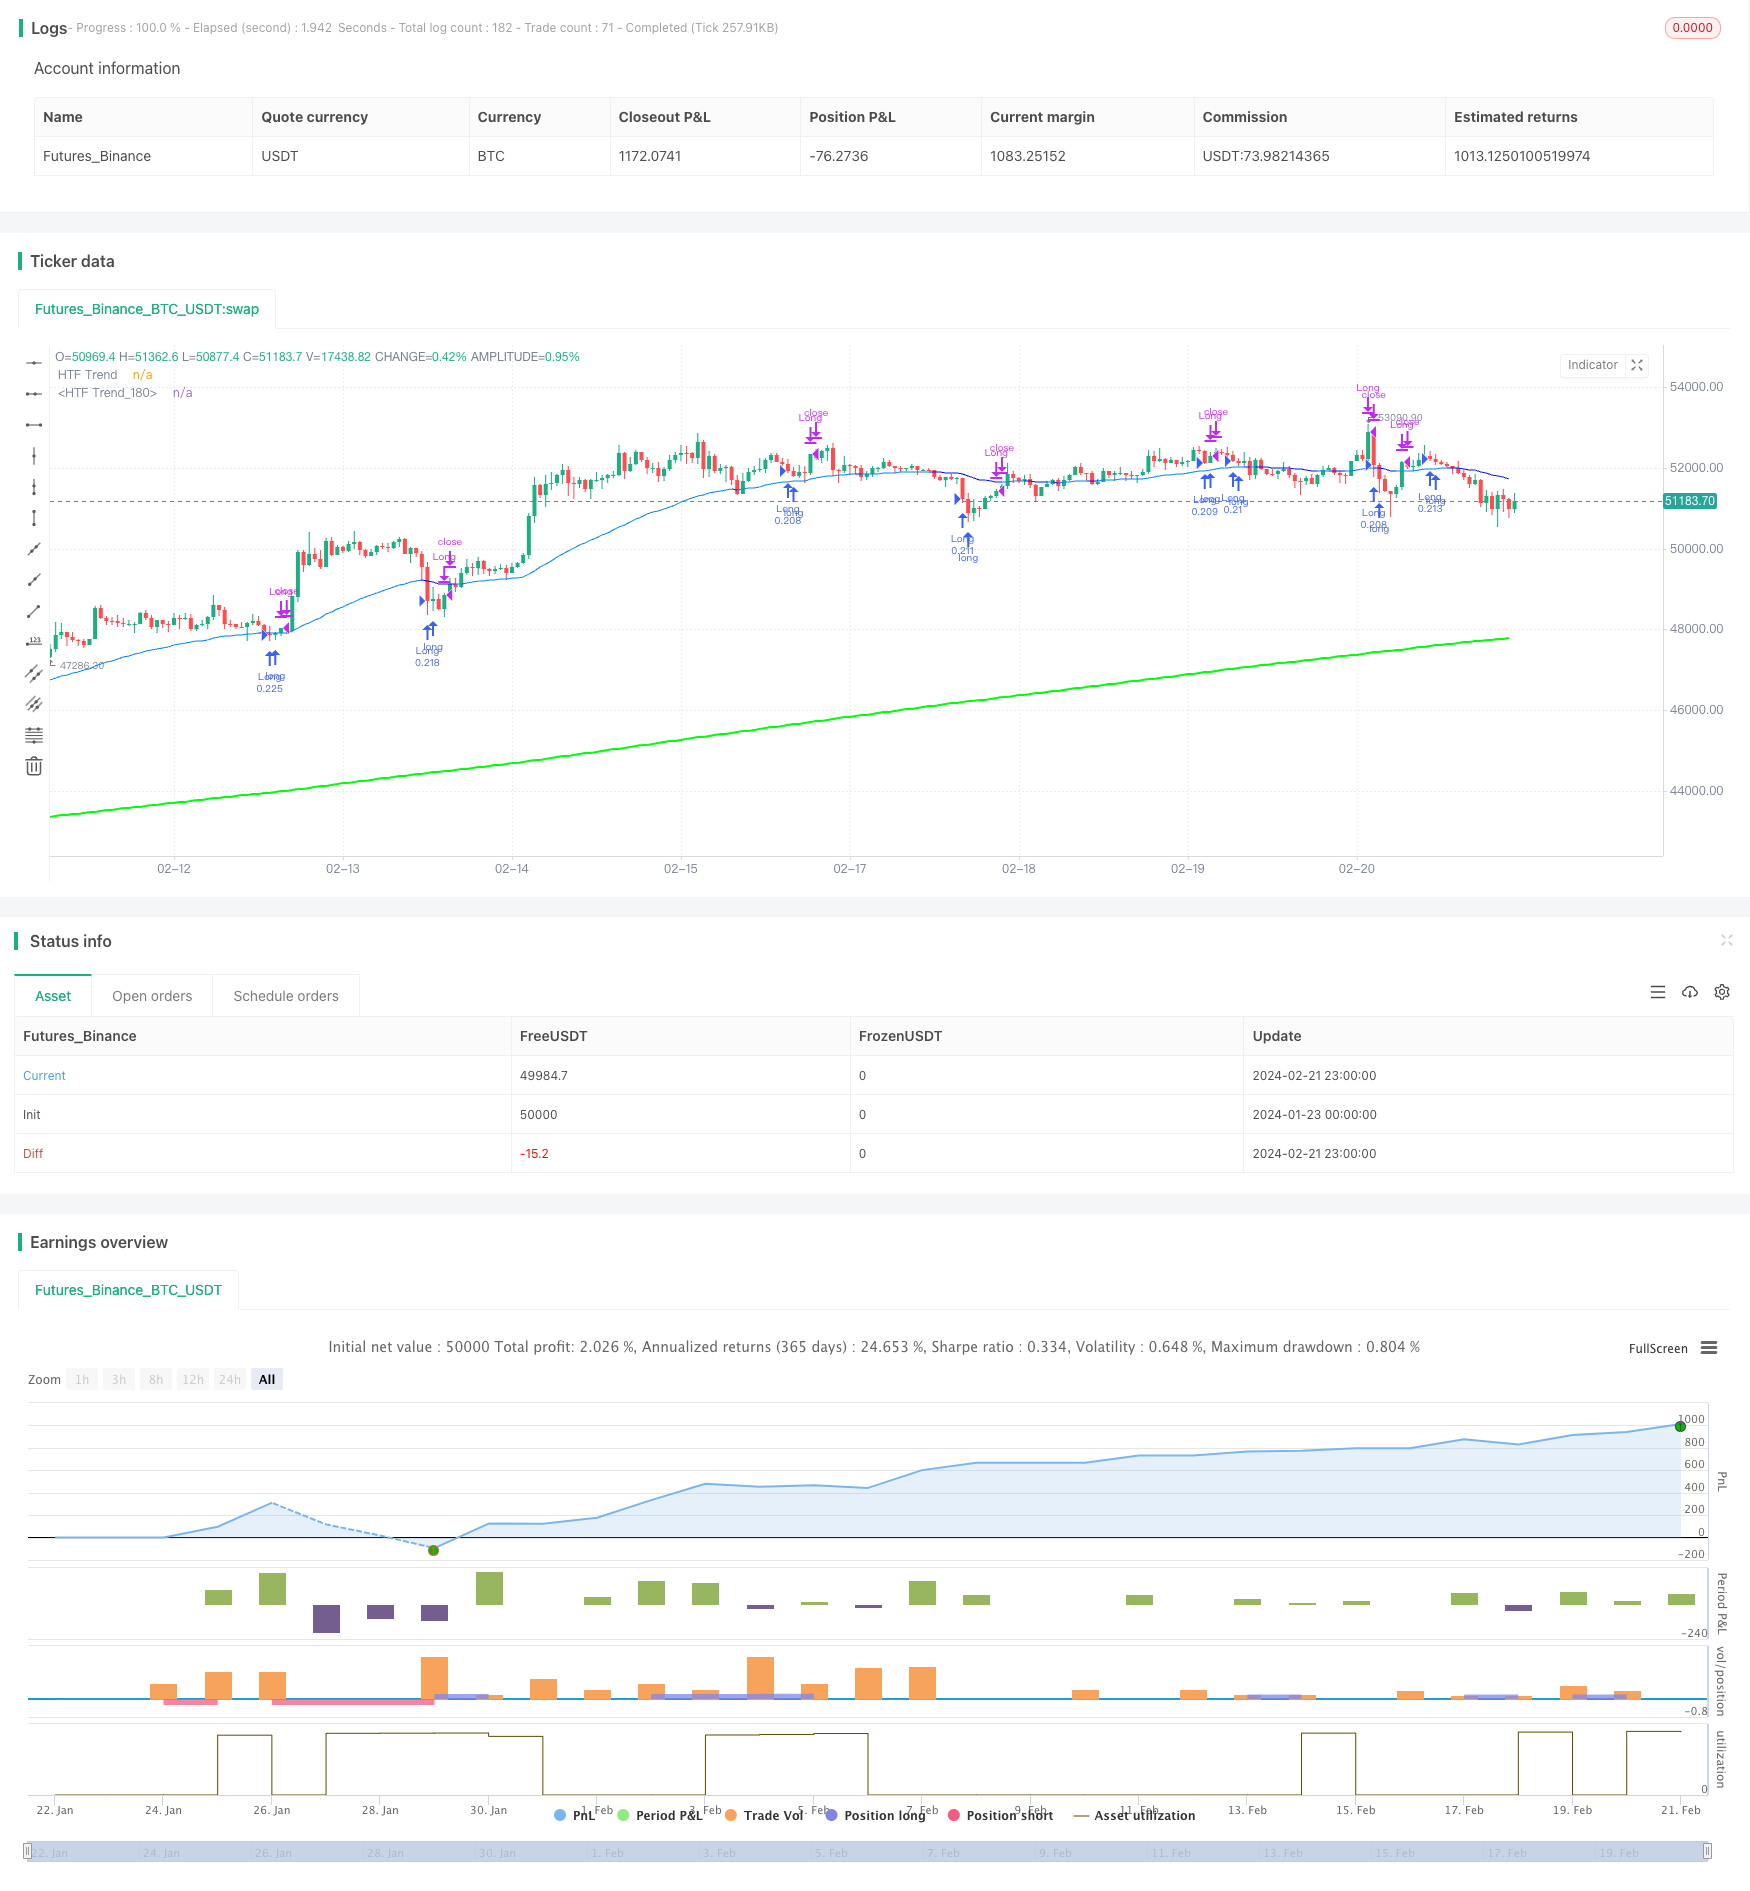
/*backtest
start: 2024-01-23 00:00:00
end: 2024-02-22 00:00:00
period: 1h
basePeriod: 15m
exchanges: [{"eid":"Futures_Binance","currency":"BTC_USDT"}]
*/

// This Pine Script™ code is subject to the terms of the Mozilla Public License 2.0 at https://mozilla.org/MPL/2.0/
// © Harrocop

//@version=5
strategy(title = "Triple MA HTF strategy - Dynamic Smoothing", shorttitle = "Triple MA strategy", overlay=true,
         pyramiding=5, initial_capital = 10000,
         calc_on_order_fills=false,
         slippage = 0,
         commission_type=strategy.commission.percent, commission_value=0.05)

//////////////////////////////////////////////////////
//////////         Risk Management        ////////////
//////////////////////////////////////////////////////
RISKM = "-------------------- Risk Management  --------------------"
InitialBalance = input.float(defval = 10000, title = "Initial Balance", minval = 1, maxval = 1000000, step = 1000, tooltip = "starting capital", group = RISKM)
LeverageEquity = input.bool(defval = true, title = "qty based on equity %", tooltip = "true turns on MarginFactor based on equity, false gives fixed qty for positionsize", group = RISKM)
MarginFactor = input.float(0, minval = - 0.9, maxval = 100, step = 0.1, tooltip = "Margin Factor, meaning that 0.5 will add 50% extra capital to determine ordersize quantity, 0.0 means 100% of equity is used to decide quantity of instrument", inline = "qty", group = RISKM)
QtyNr = input.float(defval = 3.5, title = "Quantity Contracts", minval = 0, maxval = 1000000, step = 0.01,  tooltip = "Margin Factor, meaning that 0.5 will add 50% extra capital to determine ordersize quantity, 0.0 means 100% of equity is used to decide quantity of instrument", inline = "qty", group = RISKM)
EquityCurrent = InitialBalance + strategy.netprofit[1]
QtyEquity = EquityCurrent * (1 + MarginFactor) / close[1]
QtyTrade = LeverageEquity ? QtyEquity : QtyNr

/////////////////////////////////////////////////////
//////////       MA Filter Trend         ////////////
/////////////////////////////////////////////////////
TREND = "-------------------- Moving Average 1 --------------------"
Plot_MA = input.bool(true, title = "Plot MA trend?", inline = "Trend1", group = TREND)
TimeFrame_Trend = input.timeframe(title='Higher Time Frame', defval='15', inline = "Trend1", group = TREND)
length = input.int(21, title="Length MA", minval=1, tooltip = "Number of bars used to measure trend on higher timeframe chart", inline = "Trend2", group = TREND)
MA_Type  = input.string(defval="McGinley" , options=["EMA","DEMA","TEMA","SMA","WMA", "HMA", "McGinley"], title="MA type:", inline = "Trend2", group = TREND)

ma(type, src, length) =>
    float result = 0
    if type == 'TMA' // Triangular Moving Average
        result := ta.sma(ta.sma(src, math.ceil(length / 2)), math.floor(length / 2) + 1)
        result
    if type == 'LSMA' // Least Squares Moving Average
        result := ta.linreg(src, length, 0)
        result
    if type == 'SMA'  // Simple Moving Average
        result := ta.sma(src, length)
        result
    if type == 'EMA'  // Exponential Moving Average
        result := ta.ema(src, length)
        result
    if type == 'DEMA'  // Double Exponential Moving Average
        e = ta.ema(src, length)
        result := 2 * e - ta.ema(e, length)
        result
    if type == 'TEMA'  // Triple Exponentiale
        e = ta.ema(src, length)
        result := 3 * (e - ta.ema(e, length)) + ta.ema(ta.ema(e, length), length)
        result
    if type == 'WMA'  // Weighted Moving Average
        result := ta.wma(src, length)
        result
    if type == 'HMA'  // Hull Moving Average
        result := ta.wma(2 * ta.wma(src, length / 2) - ta.wma(src, length), math.round(math.sqrt(length)))
        result
    if type == 'McGinley' // McGinley Dynamic Moving Average
        mg = 0.0
        mg := na(mg[1]) ? ta.ema(src, length) : mg[1] + (src - mg[1]) / (length * math.pow(src / mg[1], 4))
        result := mg
        result
    result

// Moving Average
MAtrend = ma(MA_Type, close, length)
MA_Value_HTF = request.security(syminfo.tickerid, TimeFrame_Trend, MAtrend)

// Get minutes for current and higher timeframes
// Function to convert a timeframe string to its equivalent in minutes
timeframeToMinutes(tf) =>
    multiplier = 1
    if (str.endswith(tf, "D"))
        multiplier := 1440
    else if (str.endswith(tf, "W"))
        multiplier := 10080
    else if (str.endswith(tf, "M"))
        multiplier := 43200
    else if (str.endswith(tf, "H"))
        multiplier := int(str.tonumber(str.replace(tf, "H", "")))
    else
        multiplier := int(str.tonumber(str.replace(tf, "m", "")))
    multiplier

// Get minutes for current and higher timeframes
currentTFMinutes = timeframeToMinutes(timeframe.period)
higherTFMinutes = timeframeToMinutes(TimeFrame_Trend)

// Calculate the smoothing factor
dynamicSmoothing = math.round(higherTFMinutes / currentTFMinutes)
MA_Value_Smooth = ta.sma(MA_Value_HTF, dynamicSmoothing)

// Trend HTF
UP = MA_Value_Smooth > MA_Value_Smooth[1] // Use "UP" Function to use as filter in combination with other indicators
DOWN = MA_Value_Smooth < MA_Value_Smooth[1] // Use "Down" Function to use as filter in combination with other indicators

/////////////////////////////////////////////////////
//////////       Second MA Filter Trend   ///////////
/////////////////////////////////////////////////////
TREND2 = "-------------------- Moving Average 2 --------------------"
Plot_MA2 = input.bool(true, title = "Plot Second MA trend?", inline = "Trend3", group = TREND2)
TimeFrame_Trend2 = input.timeframe(title='HTF', defval='60', inline = "Trend3", group = TREND2)
length2 = input.int(21, title="Length Second MA", minval=1, tooltip = "Number of bars used to measure trend on higher timeframe chart", inline = "Trend4", group = TREND2)
MA_Type2  = input.string(defval="McGinley" , options=["EMA","DEMA","TEMA","SMA","WMA", "HMA", "McGinley"], title="MA type:", inline = "Trend4", group = TREND2)

// Second Moving Average
MAtrend2 = ma(MA_Type2, close, length2)
MA_Value_HTF2 = request.security(syminfo.tickerid, TimeFrame_Trend2, MAtrend2)

// Get minutes for current and higher timeframes
higherTFMinutes2 = timeframeToMinutes(TimeFrame_Trend2)

// Calculate the smoothing factor for the second moving average
dynamicSmoothing2 = math.round(higherTFMinutes2 / currentTFMinutes)
MA_Value_Smooth2 = ta.sma(MA_Value_HTF2, dynamicSmoothing2)

// Trend HTF for the second moving average
UP2 = MA_Value_Smooth2 > MA_Value_Smooth2[1]
DOWN2 = MA_Value_Smooth2 < MA_Value_Smooth2[1]

/////////////////////////////////////////////////////
//////////       Third MA Filter Trend    ///////////
/////////////////////////////////////////////////////
TREND3 = "-------------------- Moving Average 3 --------------------"
Plot_MA3 = input.bool(true, title = "Plot third MA trend?", inline = "Trend5", group = TREND3)
TimeFrame_Trend3 = input.timeframe(title='HTF', defval='240', inline = "Trend5", group = TREND3)
length3 = input.int(50, title="Length third MA", minval=1, tooltip = "Number of bars used to measure trend on higher timeframe chart", inline = "Trend6", group = TREND3)
MA_Type3  = input.string(defval="McGinley" , options=["EMA","DEMA","TEMA","SMA","WMA", "HMA", "McGinley"], title="MA type:", inline = "Trend6", group = TREND3)

// Second Moving Average
MAtrend3 = ma(MA_Type3, close, length3)
MA_Value_HTF3 = request.security(syminfo.tickerid, TimeFrame_Trend3, MAtrend3)

// Get minutes for current and higher timeframes
higherTFMinutes3 = timeframeToMinutes(TimeFrame_Trend3)

// Calculate the smoothing factor for the second moving average
dynamicSmoothing3 = math.round(higherTFMinutes3 / currentTFMinutes)
MA_Value_Smooth3 = ta.sma(MA_Value_HTF3, dynamicSmoothing3)

// Trend HTF for the second moving average
UP3 = MA_Value_Smooth3 > MA_Value_Smooth3[1]
DOWN3 = MA_Value_Smooth3 < MA_Value_Smooth3[1]

/////////////////////////////////////////////////////
//////////         Entry Settings        ////////////
/////////////////////////////////////////////////////
BuySignal = ta.crossover(MA_Value_HTF, MA_Value_HTF2) and UP3 == true
SellSignal = ta.crossunder(MA_Value_HTF, MA_Value_HTF2) and DOWN3 == true
ExitBuy = ta.crossunder(MA_Value_HTF, MA_Value_HTF2)
ExitSell = ta.crossover(MA_Value_HTF, MA_Value_HTF2)

/////////////////////////////////////////////////
///////////       Strategy       ////////////////
///////////      Entry & Exit    ////////////////
///////////         logic        ////////////////
/////////////////////////////////////////////////
// Long
if BuySignal
    strategy.entry("Long", strategy.long, qty = QtyTrade)

if (strategy.position_size > 0 and ExitBuy == true)
    strategy.close(id = "Long", comment = "Close Long")

// Short
if SellSignal
    strategy.entry("Short", strategy.short, qty = QtyTrade)

if (strategy.position_size < 0 and ExitSell == true)
    strategy.close(id = "Short", comment = "Close Short")

/////////////////////////////////////////////////////
//////////         Visuals Chart         ////////////
/////////////////////////////////////////////////////
// Plot Moving Average HTF
p1 = plot(Plot_MA ? MA_Value_Smooth : na, "HTF Trend", color = UP ? color.rgb(238, 255, 0) : color.rgb(175, 173, 38), linewidth = 1, style = plot.style_line)
p2 = plot(Plot_MA2 ? MA_Value_Smooth2 : na, "HTF Trend", color = UP2 ? color.rgb(0, 132, 255) : color.rgb(0, 17, 255), linewidth = 1, style = plot.style_line)
plot(Plot_MA3 ? MA_Value_Smooth3 : na, "HTF Trend", color = UP3 ? color.rgb(0, 255, 8) : color.rgb(255, 0, 0), linewidth = 2, style = plot.style_line)
fill(p1, p2, color = color.rgb(255, 208, 0, 90), title="Fill")