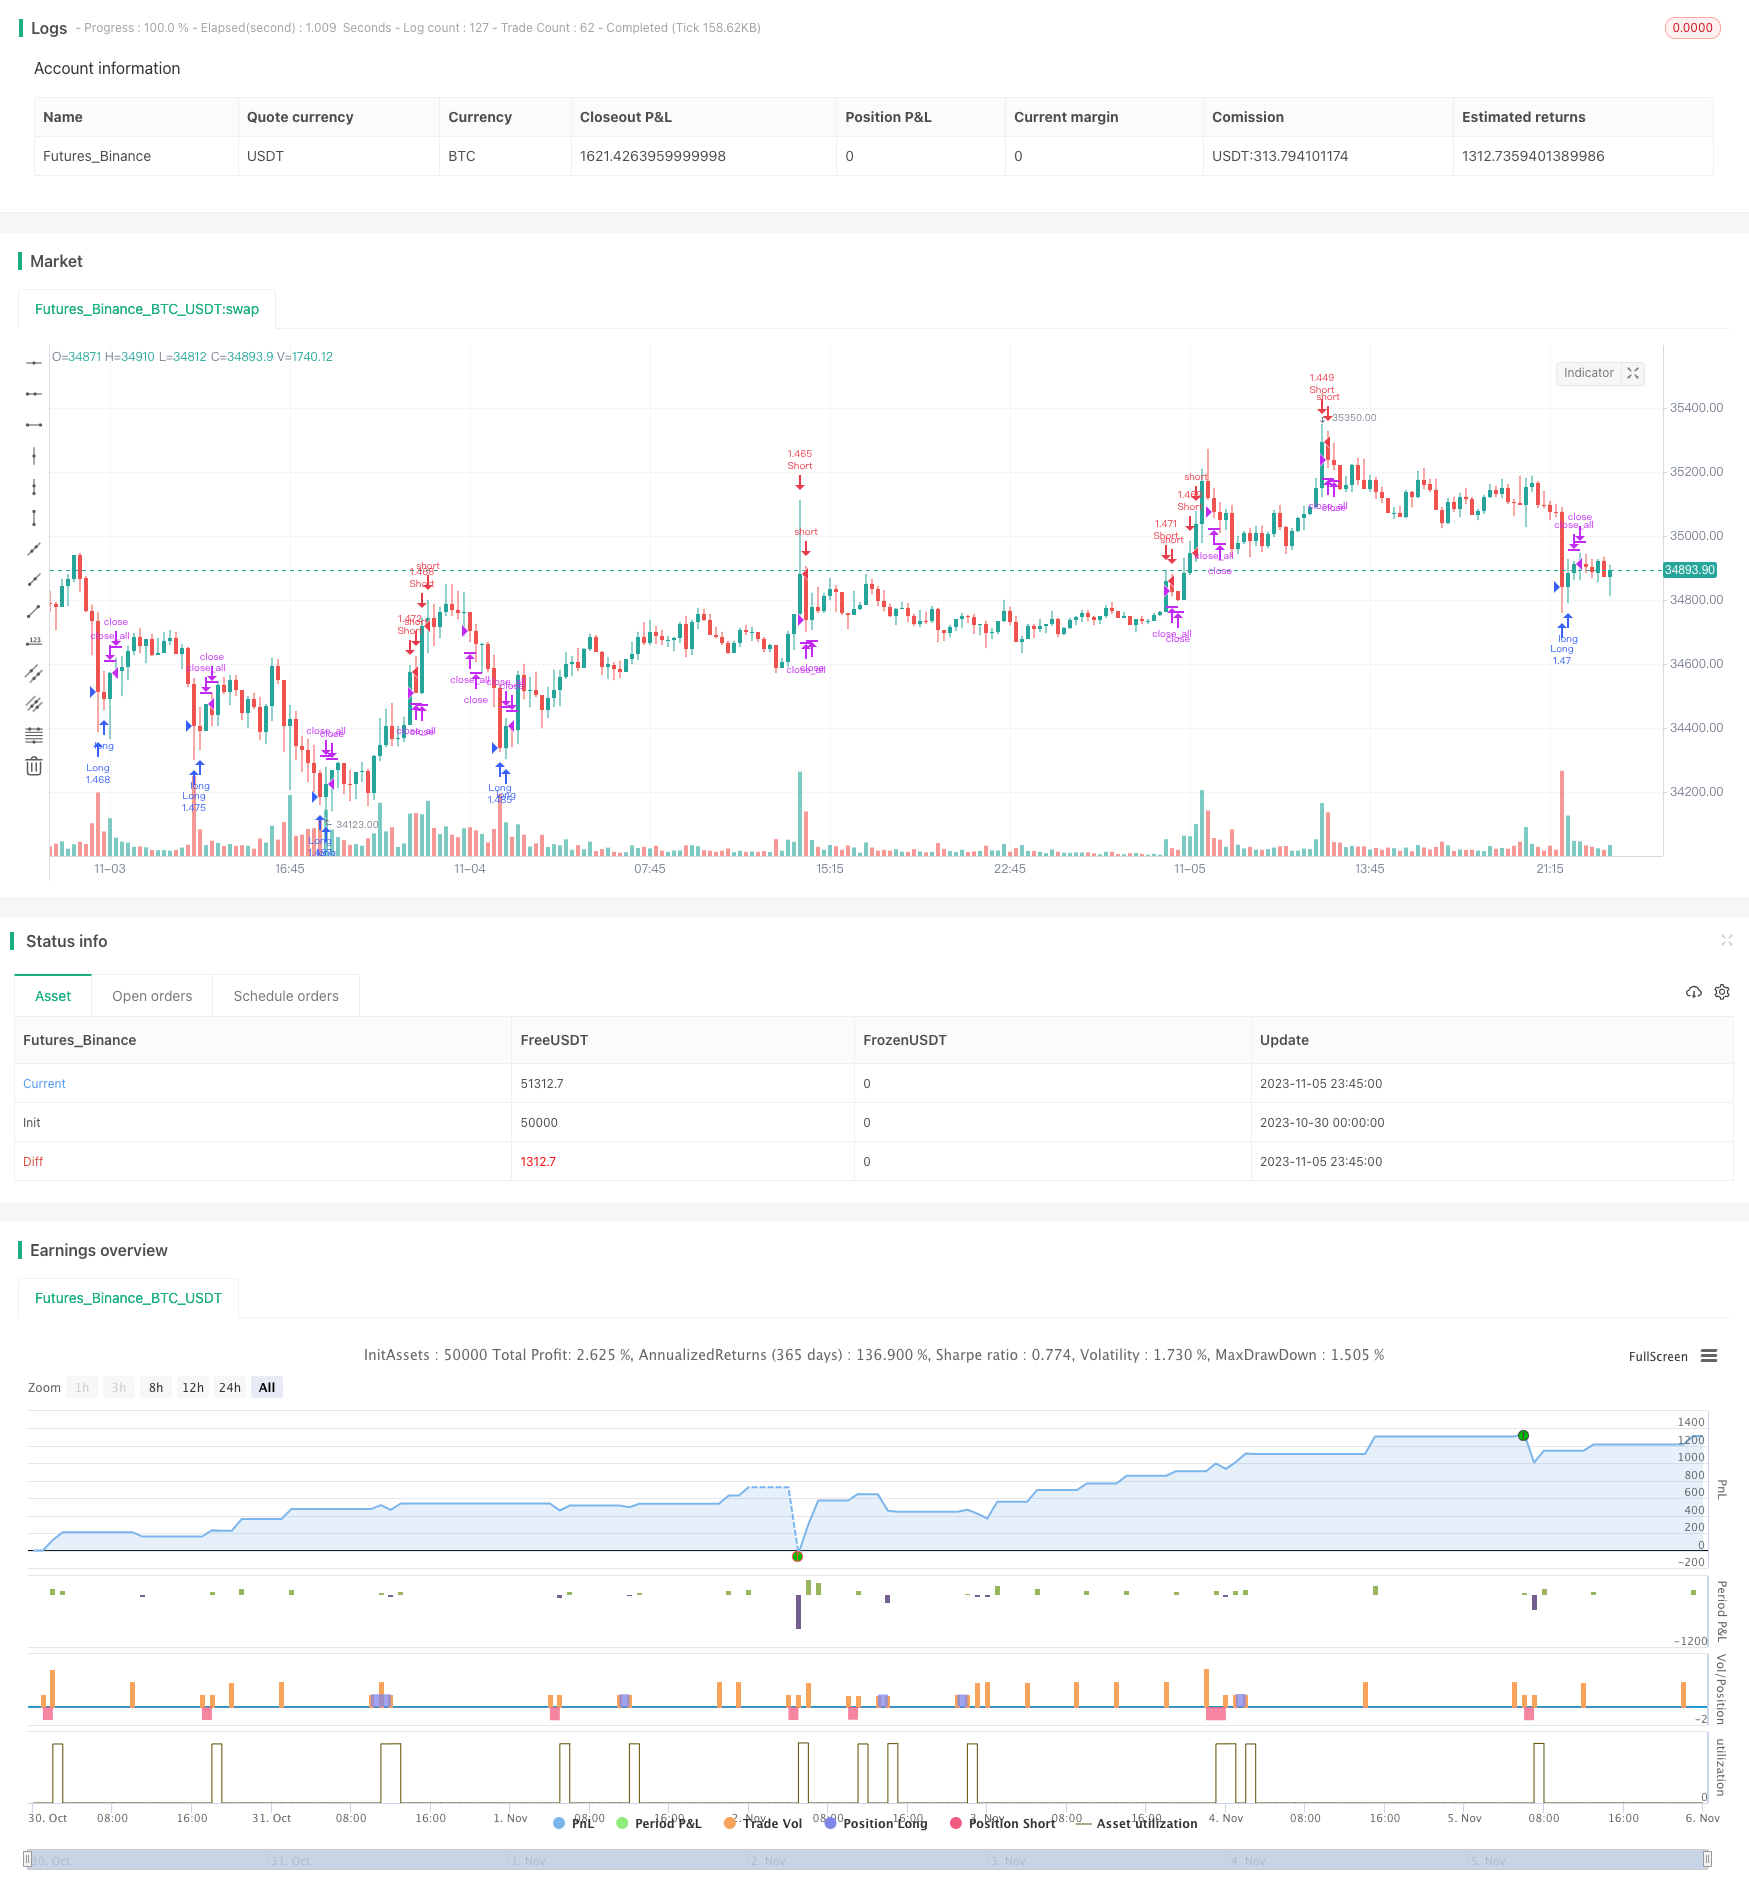
高速RSIインジケーター二次突破戦略

概要
この戦略は,RSI指標のパラメータを複数回設定することで,価格の複数の突破を実現し,より正確な入場と退出信号を実現します.
戦略原則
この戦略は,RSI周期7のRSI指標と,RSI周期14のRSI指標25のRSI指標を設定しています. 価格が任意のRSIグループの制限を破るとき,オールまたは空白操作を実行します.
策略は,まず2つのRSI指標の値を計算し,価格がRSIの上限または下限を突破したかどうかを判断します. 上限を突破すると多値シグナルが生じ,下限を突破すると空値シグナルが生じます.
もし既にポジションを持っているなら,現在のRSIが正常な範囲にあるかどうかを判断し続けます. RSIが正常であると同時に,実体が平均線の半分を突破すると,退出信号が生じます.
この戦略は,マーティンゲル加減システムも使用しています. 損失の1回で,次の取引量は倍になります.
優位分析
2つのRSI指標を使用して,突破信号をより正確に判断し,偽突破を避けることができます.
金融危機の危機を回避するために,実体的な破綻をチェックする.
マルティンガルの加減は,損失の後に迅速に止まります.
RSIパラメータのカスタマイズ可能な組み合わせで,入学機会を最適化します.
取引期間を制限し,重大事件の影響を回避する.
リスク分析
双RSIは偽突破を完全に回避することはできません.
マルティンガルは,負債でポジションを拡大し,破綻する傾向があります.
取引コストの影響は考慮されていません.
最適化できるパラメータは多く,最適なパラメータの組み合わせを見つけるために大量のテストが必要です.
損失を制限するためにストップを設定できます. RSIパラメータの組み合わせを最適化します. コストの考慮を追加します. 突破判断を適切に緩和します.
戦略最適化の方向性
損失の最大限を制限するストップ・メカニズムに加入する.
RSIパラメータの組み合わせを最適化して,偽突破を減らすために最適なパラメータを見つけます.
取引コストの影響を考慮し,取引を頻繁にしないようにしてください.
取引の機会を拡大するために,ブレイク判断を緩和します.
フィルタリングの要素が追加されれば, フィルタリングが遮断されない.
要約する
この戦略は,価格の突破を判断するために双RSI指標を使用し,実体突破の判断を加え,揺れ動いている市場で被套を避ける.同時に,マーティンゲル加仓を迅速に停止するために採用する.この戦略は,パラメータの最適化とより多くの指標のフィルターの追加により,より正確な取引信号を得ることができます.しかし,損失の拡大を防ぐためにリスク管理に注意する必要があります.全体的に,この戦略は,比較的安定した突破システムを提供し,高効率の取引を追求する投資家に適しています.
/*backtest
start: 2023-10-30 00:00:00
end: 2023-11-06 00:00:00
period: 15m
basePeriod: 5m
exchanges: [{"eid":"Futures_Binance","currency":"BTC_USDT"}]
*/

//Noro
//2018

//@version=2
strategy(title = "Noro's Fast RSI Strategy v2.0", shorttitle = "Fast RSI str 2.0", overlay = true)

//Settings
needlong = input(true, defval = true, title = "Long")
needshort = input(true, defval = true, title = "Short")
usemar = input(false, defval = false, title = "Use Martingale")
capital = input(100, defval = 100, minval = 1, maxval = 10000, title = "Capital, %")
usersi1 = input(true, defval = true, title = "Use RSI #1")
rsiperiod1 = input(7, defval = 7, minval = 2, maxval = 50, title = "#1 RSI Period")
rsilimit1 = input(25, defval = 25, minval = 1, maxval = 100, title = "#1 RSI limit")
usersi2 = input(true, defval = true, title = "Use RSI #2")
rsiperiod2 = input(14, defval = 14, minval = 2, maxval = 50, title = "#2 RSI Period")
rsilimit2 = input(25, defval = 25, minval = 1, maxval = 100, title = "#2 RSI limit")
showarr = input(false, defval = false, title = "Show Arrows")
fromyear = input(2018, defval = 2018, minval = 1900, maxval = 2100, title = "From Year")
toyear = input(2100, defval = 2100, minval = 1900, maxval = 2100, title = "To Year")
frommonth = input(01, defval = 01, minval = 01, maxval = 12, title = "From Month")
tomonth = input(12, defval = 12, minval = 01, maxval = 12, title = "To Month")
fromday = input(01, defval = 01, minval = 01, maxval = 31, title = "From day")
today = input(31, defval = 31, minval = 01, maxval = 31, title = "To day")

//RSI #1
uprsi1 = rma(max(change(close), 0), rsiperiod1)
dnrsi1 = rma(-min(change(close), 0), rsiperiod1)
rsi1 = dnrsi1 == 0 ? 100 : uprsi1 == 0 ? 0 : 100 - (100 / (1 + uprsi1 / dnrsi1))
uplimit1 = 100 - rsilimit1
dnlimit1 = rsilimit1

//RSI #2
uprsi2 = rma(max(change(close), 0), rsiperiod2)
dnrsi2 = rma(-min(change(close), 0), rsiperiod2)
rsi2 = dnrsi2 == 0 ? 100 : uprsi2 == 0 ? 0 : 100 - (100 / (1 + uprsi2 / dnrsi2))
uplimit2 = 100 - rsilimit2
dnlimit2 = rsilimit2

//Body
body = abs(close - open)
abody = sma(body, 10)

//Signals
bar = close > open ? 1 : close < open ? -1 : 0
up1 = bar == -1 and (strategy.position_size == 0 or close < strategy.position_avg_price) and rsi1 < dnlimit1 and body > abody / 5 and usersi1
dn1 = bar == 1 and (strategy.position_size == 0 or close > strategy.position_avg_price) and rsi1 > uplimit1 and body > abody / 5 and usersi1
up2 = bar == -1 and (strategy.position_size == 0 or close < strategy.position_avg_price) and rsi2 < dnlimit2 and body > abody / 5 and usersi2
dn2 = bar == 1 and (strategy.position_size == 0 or close > strategy.position_avg_price) and rsi2 > uplimit2 and body > abody / 5 and usersi2
norma = rsi1 > dnlimit1 and rsi1 < uplimit1 and rsi2 > dnlimit2 and rsi2 < uplimit2
exit = (((strategy.position_size > 0 and bar == 1 and norma) or (strategy.position_size < 0 and bar == -1 and norma)) and body > abody / 2)

//Arrows
col = exit ? black : up1 or dn1 ? blue : up2 or dn2 ? red : na
needup = up1 or up2
needdn = dn1 or dn2
needexitup = exit and strategy.position_size < 0
needexitdn = exit and strategy.position_size > 0
plotarrow(showarr and needup ? 1 : na, colorup = blue, colordown = blue, transp = 0)
plotarrow(showarr and needdn ? -1 : na, colorup = blue, colordown = blue, transp = 0)
plotarrow(showarr and needexitup ? 1 : na, colorup = black, colordown = black, transp = 0)
plotarrow(showarr and needexitdn ? -1 : na, colorup = black, colordown = black, transp = 0)

//Trading
profit = exit ? ((strategy.position_size > 0 and close > strategy.position_avg_price) or (strategy.position_size < 0 and close < strategy.position_avg_price)) ? 1 : -1 : profit[1]
mult = usemar ? exit ? profit == -1 ? mult[1] * 2 : 1 : mult[1] : 1
lot = strategy.position_size == 0 ? strategy.equity / close * capital / 100 * mult : lot[1]

if up1 or up2
    if strategy.position_size < 0
        strategy.close_all()

    strategy.entry("Long", strategy.long, needlong == false ? 0 : lot)

if dn1 or dn2
    if strategy.position_size > 0
        strategy.close_all()

    strategy.entry("Short", strategy.short, needshort == false ? 0 : lot)

if  exit
    strategy.close_all()