下降トレンドの短期取引戦略


作成日: 2023-11-07 17:06:59 最終変更日: 2023-11-07 17:06:59
コピー: 0 クリック数: 641
1
フォロー
1617
フォロワー

下降トレンドの短期取引戦略

概要

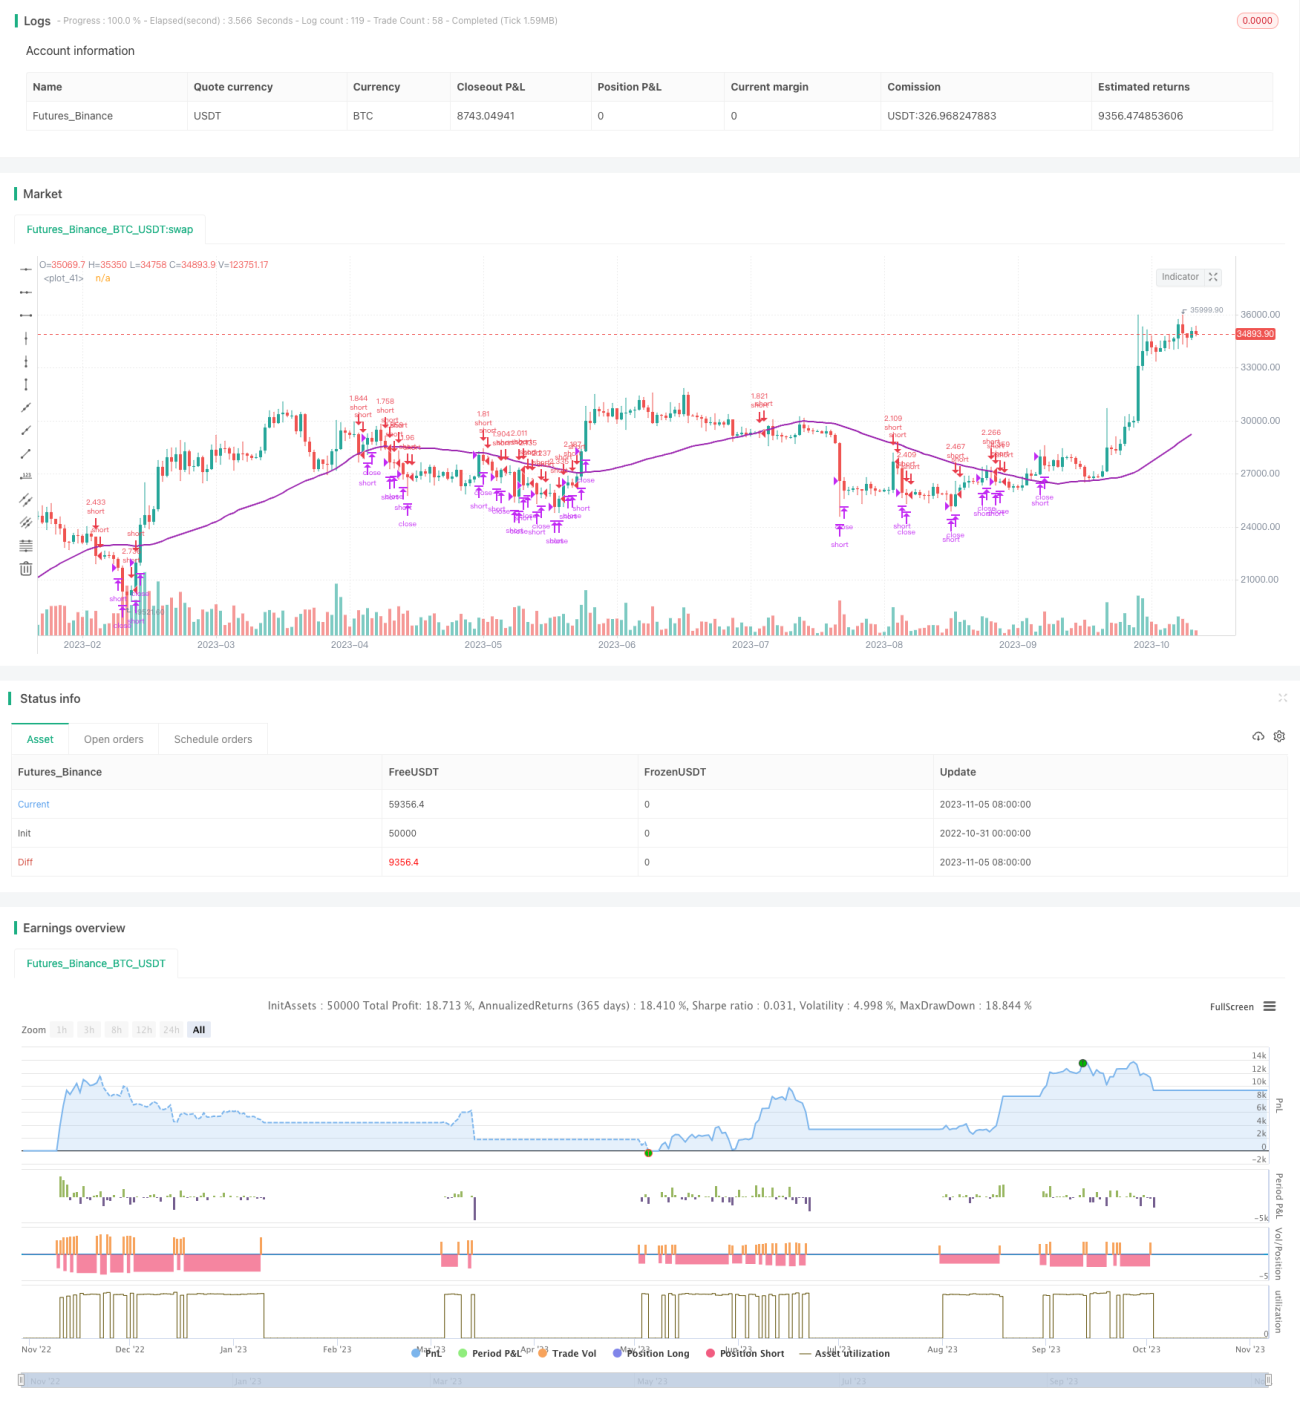
この戦略は,移動平均と相対的に強い指標を使って市場の傾向の方向を判断し,下降傾向の中で徐々にショートポジションを確立し,利益を上げます.

戦略原則

閉店価格が100日単調移動平均値より低く,RSIが30以上であるとき,空白で入場する.その後,入場価格の3%以上で,入場価格の2%以下で,ストップラインとストップオフラインを設定する.これにより,市場変動を許容するための大きなストップスペースを得ることができる.価格がストップラインより大きく,またはストップオフラインより小さいとき,ポジションを閉じる.

Coinruleのプラットフォームでは,順番を順番に設定し,順番を順番に設定し,順番を順番に設定できます. 市場が下落している場合は,順番を順番に設定し,順番を順番に追加します.

この戦略は,各取引ごとにストップ・ロース・シートとストップ・ストップ・シートを接続する.ストップ・ロース・割合とストップ・ロース・割合は,中盤通貨に最適化されている.特定の通貨に応じて調整することができます.戦略がトレンド取引方向に適合するので,ストップ・ロース・割合は1:1.5に設定できます.

スタート価格の3%で止まります. 入札価格の2%で止まる ストップ比より少し大きいものは,より大きな変動を許容し,不必要なストップを避ける.

優位分析

  • 移動平均は,市場のトレンドの方向を判断し,下落の動きをタイムリーに捉えることができます
  • 比較的に弱い指標のフィルタリングにより,盲目空白を回避できます.
  • 順調に投資を進めてリスクを最大限抑え,よりよいリスク対利益の比率を得ることができます.
  • ストップ・ロストを設定し,それぞれの取引を承受できるようにします.

リスク分析

  • V型逆転が起こり,大きな損失を招く可能性
  • ストップ・ストップ・価格の調整に注意が必要
  • ポジションの規模を合理的に管理し,過剰なレバレッジは使用しない.
  • 大規模な震動の際には,この戦略を一時的に停止して,無駄な損失を避ける.

最適化の方向

  • 異なるパラメータをテストできる移動平均指標
  • RSI指標の組み合わせで,異なるパラメータをテストできます.
  • ストップ・ストップ・ストップ比を調整し,リスク・収益比を最適化できます
  • ポジションの規模を制御するために,異なる単一の時間間隔でテストできます.

要約する

この戦略は,移動平均によってトレンドの方向を判断し,RSI指数フィルタによって特定の入場時間を決定し,下落の動きを効果的に捕捉できます.段階的な加仓方式はリスクを制御し,ストップ・ロスの設定は,1つの取引の承受力を確保します.ストップ・ロスの比率を最適化することで,よりよいリスク・リターン比率を得ることができます.パラメータ調整とリスク管理の面で最適化できる余地がありますが,全体的に安定した信頼性の高いショートライン空調戦略です.

ストラテジーソースコード
/*backtest
start: 2022-10-31 00:00:00
end: 2023-11-06 00:00:00
period: 1d
basePeriod: 1h
exchanges: [{"eid":"Futures_Binance","currency":"BTC_USDT"}]
*/

// This source code is subject to the terms of the Mozilla Public License 2.0 at https://mozilla.org/MPL/2.0/
// © Coinrule

//@version=4
strategy(shorttitle='Short In Downtrend',title='Short In Downtrend Below MA100', overlay=true, initial_capital = 1000, process_orders_on_close=true, default_qty_type = strategy.percent_of_equity, default_qty_value = 100)

//Backtest dates
fromMonth = input(defval = 1,    title = "From Month",      type = input.integer, minval = 1, maxval = 12)
fromDay   = input(defval = 10,    title = "From Day",        type = input.integer, minval = 1, maxval = 31)
fromYear  = input(defval = 2019, title = "From Year",       type = input.integer, minval = 1970)
thruMonth = input(defval = 1,    title = "Thru Month",      type = input.integer, minval = 1, maxval = 12)
thruDay   = input(defval = 1,    title = "Thru Day",        type = input.integer, minval = 1, maxval = 31)
thruYear  = input(defval = 2112, title = "Thru Year",       type = input.integer, minval = 1970)

showDate  = input(defval = true, title = "Show Date Range", type = input.bool)

start     = timestamp(fromYear, fromMonth, fromDay, 00, 00)        // backtest start window
finish    = timestamp(thruYear, thruMonth, thruDay, 23, 59)        // backtest finish window
window()  => true       // create function "within window of time"

//MA inputs and calculations
inSignal=input(50, title='MASignal')

MA= sma(close, inSignal)

// RSI inputs and calculations
lengthRSI = input(14, title = 'RSI period', minval=1)
RSI = rsi(close, lengthRSI)


//Entry 
strategy.entry(id="short", long = false, when = close < MA and RSI > 30)

//Exit
shortStopPrice  = strategy.position_avg_price * (1 + 0.03)
shortTakeProfit = strategy.position_avg_price * (1 - 0.02)

strategy.close("short", when = close > shortStopPrice or close < shortTakeProfit and window())


plot(MA, color=color.purple, linewidth=2)