
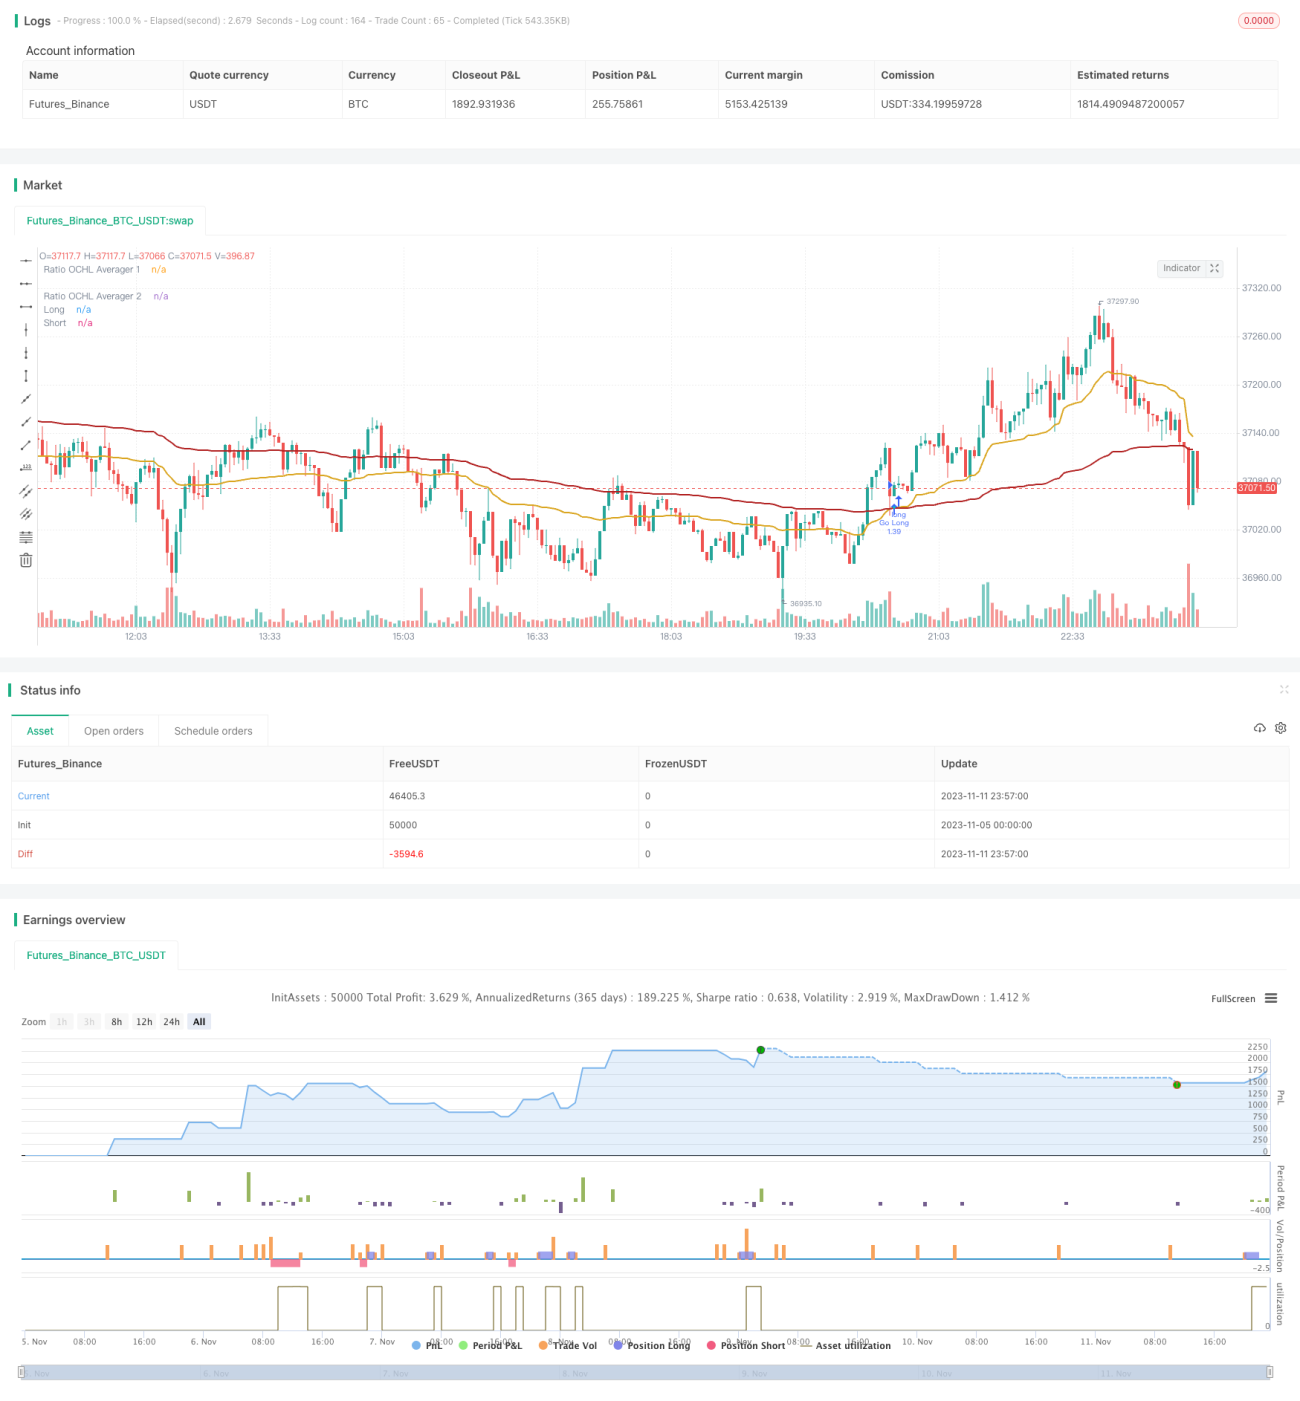
この戦略の主な考えは,異なる周期のRatio OCHL Averager指標を使用して複数の均線を構築し,均線の交差形状に応じて買入シグナルを生成することである.これは,価格の傾向を動的に捉え,中短期取引に適している.
この策略は,2つの異なる周期のRatio OCHL Averager指標を使用し,それぞれ速線と遅線として使用します. Ratio OCHL Averager指標の計算式は以下のとおりです.
b = abs(close-open)/(high - low)
c = min(max(b, 0), 1)
Ratio OCHL Averager = c*close + (1-c)*前一日Ratio OCHL Averager
bは当日の価格変動を代表する比率であり,cはbの標準化処理後の値である. Ratio OCHL Averager指標は,開場価格,閉場価格,最高価格,最低価格の4つの価格を統合して平均線を構成する.
この戦略は,快線周期が短く,慢線周期が長く設定されている. 快線上での慢線通過時に買入シグナルが生成され,逆に,快線下での慢線通過時に出売シグナルが生成される. 均線交差原理を利用してトレンドを捕捉する.
Ratio OCHL Averagerは,価格データを平滑化し,市場騒音を効果的にフィルターし,取引信号をより信頼性のあるようにします.
双均線交差は,異なる周期を組み合わせてトレンドの方向を判断し,新しいトレンドの始まりをよりよく判断することができる.
速線と遅線の周期パラメータを調整することで,異なる市場環境に対応できる.
戦略はシンプルで直感的で,理解しやすい.
リスク管理の為の,柔軟な Stop Loss Stop 基準を設定できます.
均線交差戦略は,偽信号を多く発生させ,他の技術指標と組み合わせてフィルタリングする必要がある.
合理的な選択が必要で,その選択は戦略の効果に影響を及ぼす可能性がある.
双均線交差策は,トレンド追跡策であり,震動行情には適さない.トレンド行情で使用されるべきである.
損失のリスクを低減するために,ストップ・ロスを適切に調整し,ストップ・ロックは合理的に設定する必要があります.
動量指標などと組み合わせて信号フィルタリングを行うことも考えられる.例えばMACD,KDJなど.
異なる快線と慢線周期パラメータの組み合わせをテストして,最適のパラメータを探せます.
テスト結果に基づいてストップ・ローズ・ストップポイントを最適化し,最適な設定を見つけることができる.
特定の市場環境で動的に調整するパラメータを考慮することができる.例えば,大波動時に拡大周期パラメータ.
この戦略は,全体的な考え方が明確で分かりやすく,快速で均線交差によってトレンド方向を判断し,中短期の取引に適した動的追跡戦略である.最適化余地が広く,パラメータ調整,信号フィルターなどの方法で戦略の効果をさらに改善することができる.全体的に言えば,これは柔軟で実用的トレンド取引戦略である.
/*backtest
start: 2023-11-05 00:00:00
end: 2023-11-12 00:00:00
period: 3m
basePeriod: 1m
exchanges: [{"eid":"Futures_Binance","currency":"BTC_USDT"}]
*/
//@version=4
strategy(title="[XC] Adaptive Strategy V3 - Ratio OCHL Averager no repaint",shorttitle="R_OHCL", overlay=true, currency=currency.EUR,initial_capital=10000,
default_qty_value=100, default_qty_type=strategy.percent_of_equity , calc_on_every_tick=false, calc_on_order_fills=true)
// ╔═ SETTINGS ╗
//░░░░░░░░░░░░░░░░░ ╚════════════════════════════╝ ░░░░░░░░░░░░░░░░░░░░░░░░
strategy_1 = input ( defval=true , type=input.bool , title="STRATEGY 1? —>" )
Recursive = input(false)
RES201 = "Min",RES202= "D",RES203 = "W",RES204 = "M"
//++ Resolution 1 ++
inp_resolution1 = input(600, minval=1, title="Resolution Line 1")
restype1 = input ( defval="Min" , type=input.string , title= "Resolution Line 1" , options=[ "Min","D","W","M"])
multiplier1 = restype1 == "Min" ? "" : restype1 == "D" ? "D" : restype1 == "W" ? "W" : "M"
resolution1 = tostring(inp_resolution1)+ multiplier1
//++ Resolution 2 ++
inp_resolution2 = input(1440, minval=1, title="Resolution Line 2")
restype2 = input ( defval="Min" , type=input.string , title= "Resolution Line 2" , options=["Min","D","W","M"])
multiplier2 = restype2 == "Min" ? "" : restype2 == "D" ? "D" : restype2 == "W" ? "W" : "M"
resolution2 = tostring(inp_resolution2)+ multiplier2
StopLoss = input(defval = 500 , title = "Stop Loss", minval = 0)
TakeProfit = input(defval = 2500 , title = "Take Profit", minval = 0)
// === RISK MANAGEMENT VALUE PREP ===
// if an input is less than 1, assuming not wanted so we assign 'na' value to disable it.
useTakeProfit = TakeProfit >= 1 ? TakeProfit : na
useStopLoss = StopLoss >= 1 ? StopLoss : na
// ╔═ BACKTEST RANGE ╗
//░░░░░░░░░░░░░░░░░ ╚════════════════════════════╝ ░░░░░░░░░░░░░░░░░░░░░░░░
line_breakBTR = input ( defval = true , type=input.bool , title="BACKTEST RANGE —" )
FromYear = input ( defval = 2019, title = "From Year", minval = 2017)
FromMonth = input ( defval = 1, title = "From Month", minval = 1, maxval = 12)
FromDay = input ( defval = 2, title = "From Day", minval = 1, maxval = 31)
//FromHour = input ( defval = 1, title = "From Hour", minval = 1, maxval = 24)
ToYear = input ( defval = 9999, title = "To Year", minval = 2017)
//ToHour = input ( defval = 0, title = "From Hour", minval = 0, maxval = 24)
ToMonth = input ( defval = 1, title = "To Month", minval = 1, maxval = 12)
ToDay = input ( defval = 1, title = "To Day", minval = 1, maxval = 31)
// === FUNCTION EXAMPLE ===
start = timestamp(syminfo.timezone, FromYear, FromMonth, FromDay, 0, 00) // backtest start window
finish = timestamp(syminfo.timezone, ToYear , ToMonth , ToDay , 0, 59) // backtest finish window
window() => time >= start and time <= finish ? true : false // create function "within window of time"
// ╔═ INDICATOR ╗
//░░░░░░░░░░░░░░░░░ ╚════════════════════════════╝ ░░░░░░░░░░░░░░░░░░░░░░░░
// "Ratio OCHL Averager" -> alexgrover / tradingview.com/script/RGAtOI6h-Ratio-OCHL-Averager-An-Alternative-to-VWAP/
rochla( res,Recursive)=>
//Recursive = false
H = security(syminfo.tickerid,res,high[1],gaps = barmerge.gaps_off, lookahead = barmerge.lookahead_on)
L = security(syminfo.tickerid,res,low[1] ,gaps = barmerge.gaps_off, lookahead = barmerge.lookahead_on)
d = 0.
//----
a = Recursive ? nz(d[1],open) : open
b = abs(close-a)/(H - L)
c = b > 1 ? 1 : b
d := c*close+(1-c)*nz(d[1],close)
strat1_line1=rochla(resolution1,Recursive)
strat1_line2=rochla(resolution2,Recursive)
plot(strat1_line1, title="Ratio OCHL Averager 1", color=#DAA520,linewidth=2,transp=0)
plot(strat1_line2, title="Ratio OCHL Averager 2", color=#B22222,linewidth=2,transp=0)
// ╔═ STRATEGY 1 ╗
//░░░░░░░░░░░░░░░░░ ╚════════════════════════════╝ ░░░░░░░░░░░░░░░░░░░░░░░░
trading_strat1_line1 = strategy_1 == 1 ? strat1_line1 : na
trading_strat1_line2 = strategy_1 == 1 ? strat1_line2 : na
longCross = crossunder (trading_strat1_line2, trading_strat1_line1) ? true : false
shortCross = crossover (trading_strat1_line2, trading_strat1_line1) ? true : false
plot( longCross ? trading_strat1_line1 : na , title = "Long" , color=color.aqua, style=plot.style_circles, linewidth=5, offset= 0)
plot( shortCross ? trading_strat1_line2 : na , title = "Short" , color=color.red , style=plot.style_circles, linewidth=5, offset= 0)
// ╔═ Backtest 1 ╗
//░░░░░░░░░░░░░░░░░ ╚════════════════════════════╝ ░░░░░░░░░░░░░░░░░░░░░░░░
strategy.exit("close",loss = useStopLoss, profit = useTakeProfit)
if longCross and window() and strategy_1 == 1
strategy.entry("Go Long", strategy.long)
if shortCross and window() and strategy_1 == 1
strategy.entry("Go Short", strategy.short)
//end