
概要
この戦略は,二重RSI指標を使用し,長短二方向取引を行い,同時に均線システムと組み合わせてトレンドの方向を判断し,二重RSI定量化戦略に属します.この戦略は,まず,RSI指標を使用して多空信号を判断し,次に均線と組み合わせてトレンドの方向を判断し,多空を決定し,典型的なトレンドフォロー戦略に属します.
原則分析
二重RSI量化戦略は,主に二時間周期RSI指標を取引信号判断のために使用する.戦略は,最初に2つのRSIパラメータを設定し,より長い周期が主取引判断として,より短い周期が補助フィルターとして使用する.より長い周期RSIラインの下では,セールラインを破るときに多信号を生じ,短い周期RSIライン上では,購入ラインを破るときに空調信号を生じ,二重RSI指標の長さのショートクロス取引機会を形成する.
偽信号をフィルターするために,戦略はまた,SMAとEMA平均を導入し,トレンド判断を行う.短期のSMAラインが長期EMAラインを穿越するときにのみ,RSIの多信号を考慮し,短期のSMAラインの下の長期EMAラインを穿越するときにのみ,RSIの空き信号を考慮し,双RSIの信号がトレンド方向に一致することを確認し,反トレンドの取引を避ける.
さらに,ストップ・ストップの論理を設定する. ポジション開設後,同時に2つの異なる数のストップ・ストップのカードを下し,ストップ・ストップの位置を設定する.
優位分析
双RSI量化戦略には以下の利点があります.
-
双時間周期RSI指標は多空信号をより正確に判断できる.長短周期RSIのクロス組み合わせは,部分的な偽信号をフィルターして信号品質を向上させることができる.
-
均線システムは,大きなトレンドの方向を判断し,反トレンドの取引を避け,ほとんどのノイズ取引をフィルターし,勝利率を上げることができます.
-
柔軟なストップ・ストップ・メカニズムにより,異なるストップ設定により,より高い利益を得ることができ,また,リスクを制御するためにストップ・ストップすることもできます.
-
戦略的な取引の論理は,単純で明快で,容易に理解し,最適化され,量化トレーダーに学ぶのに適しています.
リスク分析
双RSIの定量化戦略にはいくつかの利点がありますが,以下のリスクがあります.
-
RSI指数自体は,波動やトレンドの逆転の判断に効果がないため,これらの市場での戦略の取引効果は良くない可能性があります.
-
均線システムは,小範囲のノイズをフィルタリングできるが,中間周期のトレンド変化の判断は不十分であり,トレンド転換点を逃す可能性がある.
-
ストップ・ロスの設定が不適切である場合,ストップ・ロスがあまりにも広いかストップ・ロスがあまりにも小さいことが起こり,戦略の効果が低下する.
-
大規模な空調や過剰空調は,損失の拡大につながる可能性があるため,ポジションの規模を制御する必要があります.
上記のリスクに対して,RSIパラメータを調整し,より高度なトレンドと逆転指標を導入し,ストップ・ストップ・ロスのロジックを最適化し,ポジションを制御することでリスクを軽減することができます.
最適化の方向
双RSIの量化戦略は,以下の方向からさらに最適化できます.
-
異なるパラメータの組み合わせを試し,RSI周期パラメータを最適化して,最適な長短周期RSI指標の組み合わせを見つけます.
-
異なる平均線指標をテストし,MACDなどの指標を導入し,トレンドと逆転の機会を判断する.
-
ストップ・ストップ・ストップの戦略を最適化して,ストップ・ストップの柔軟性を高めるために,ストップ・ストップを追跡するストップまたは移動ストップを設定します.
-
ポジションコントロールモジュールを追加し,大周期トレンドの異なる段階で空白ポジションをコントロールする.
-
機械学習モデルの追加により,エントリーとエグジットの精度が向上する.
-
分析と最適化により,最適の取引品種とタイミングを特定する.
要約する
双RSI定量化戦略は全体として典型的なトレンド追跡戦略である.双RSI指標を判断する取引信号と均線システムフィルターノイズを融合した戦略的考え方は非常に古典的で実用的である.戦略にも一定の改善の余地があるが,全体的な運行ロジックは明確で,容易に理解し,最適化できる.これは,量化取引初心者の学習と実践に適した戦略である.Practice makes perfectの原則によって,この戦略を継続的に最適化して<unk>代することで,安定した取引結果を得ることができる.
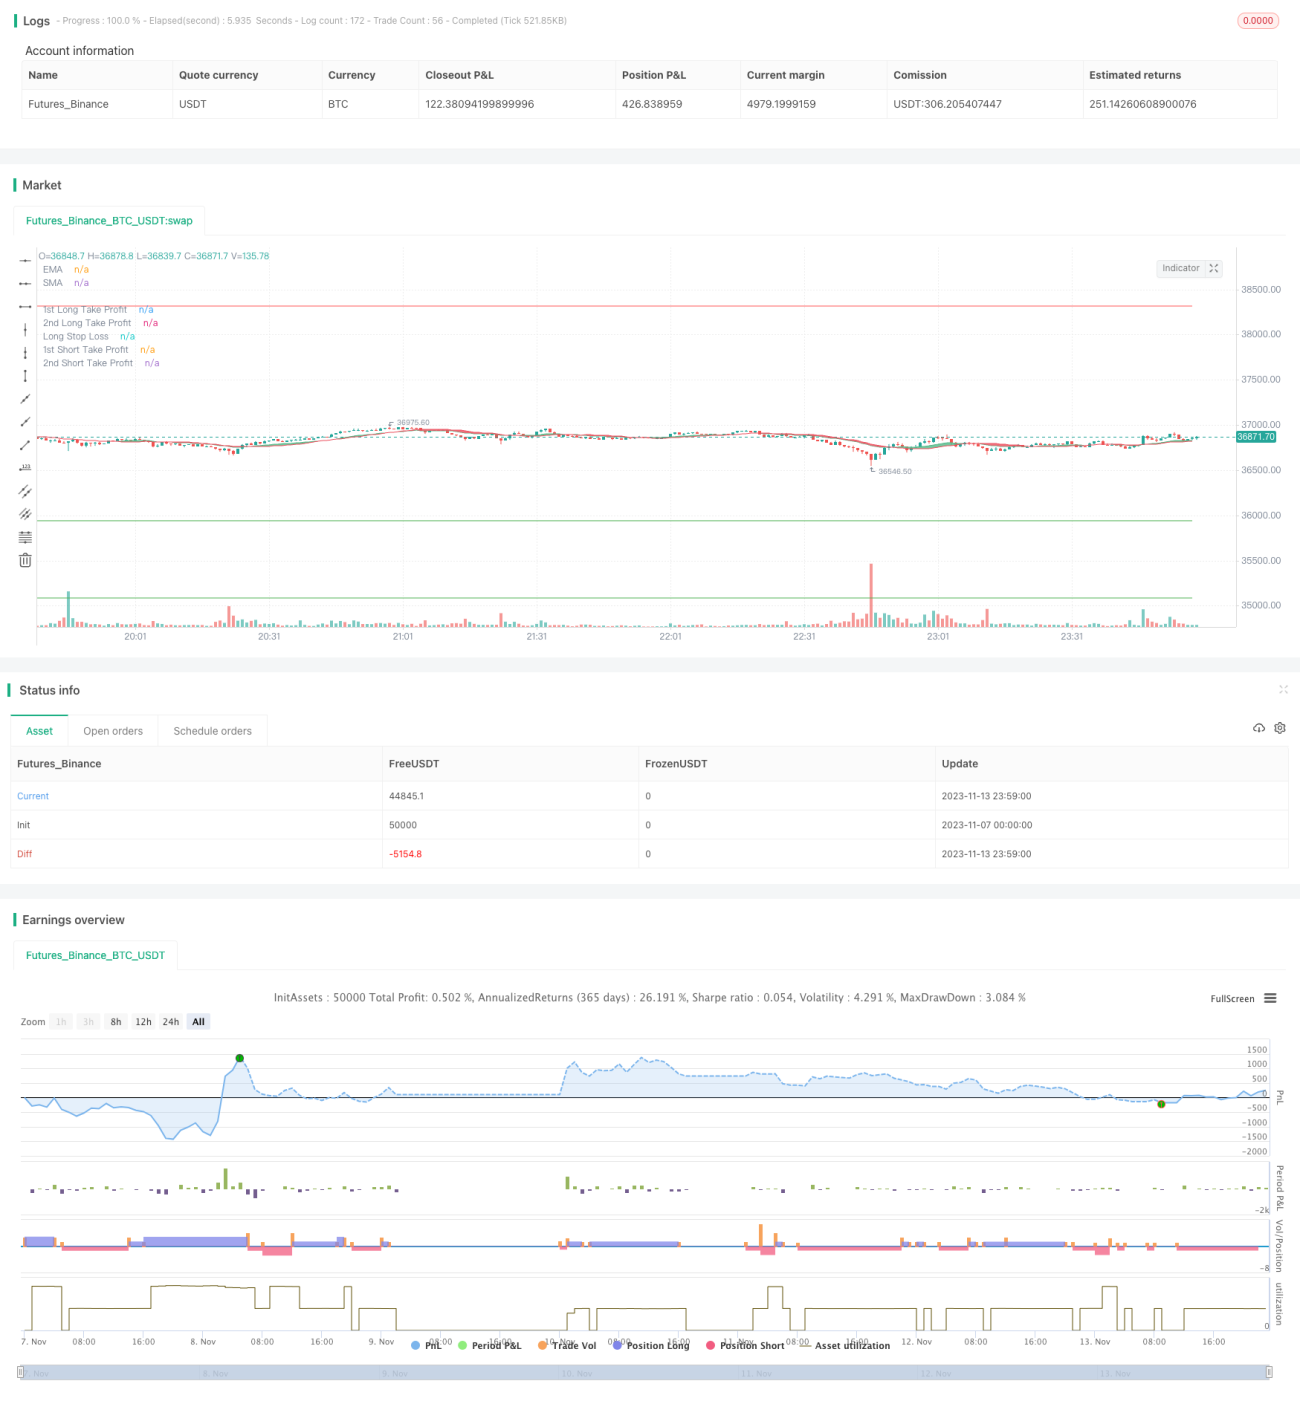
/*backtest
start: 2023-11-07 00:00:00
end: 2023-11-14 00:00:00
period: 1m
basePeriod: 1m
exchanges: [{"eid":"Futures_Binance","currency":"BTC_USDT"}]
*/

//@version=4
strategy("Growth Producer", overlay=true, initial_capital = 1000, currency = "USD", pyramiding = 2, commission_type=strategy.commission.percent, commission_value=0.07, default_qty_type = strategy.percent_of_equity, default_qty_value = 100)

//Functions- 1