移動平均線に基づくトレンドフォロー戦略

概要
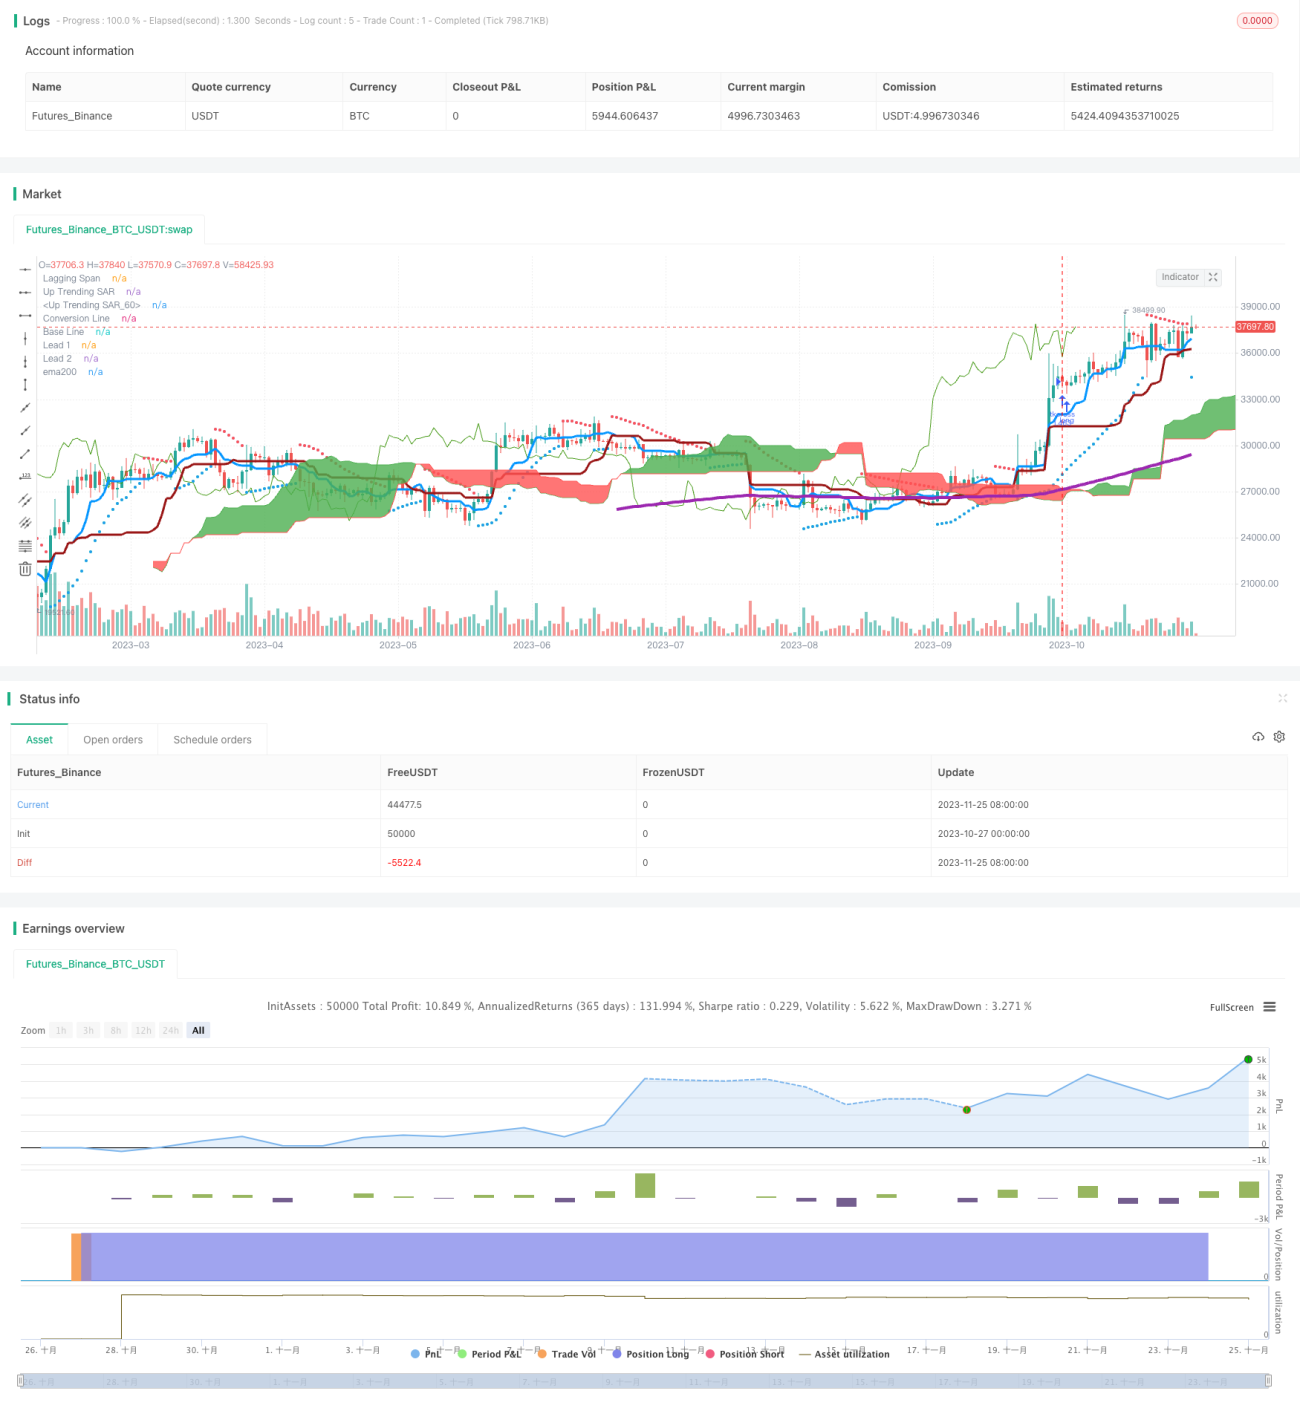
この策略は均線に基づくトレンド追跡型の策略である.イチモク雲図指標を用いてトレンドの方向を判断し,200日移動平均のフィルター信号と組み合わせてトレンド追跡を実現する.
戦略原則
この戦略は,主に雲図の変換線とベースラインを使用して,トレンドの方向を判断する.変換線は,過去9日の平均価格であり,ベースラインは過去26日の平均価格である.変換線がベースラインを横切るときは,買い信号であり,下は売り信号である.
この戦略はまた,200日移動平均を使用してシグナルをフィルタリングする. 閉盘価格が200日線以上である場合にのみ,買入シグナルが発生する. これは,ほとんどの偽のシグナルをフィルタリングする.
退出の場合は,基本線を平衡信号として変換線下を通過する簡単な策略を使用する.
優位分析
この戦略は,トレンド判断指標の1雲図と長期トレンドフィルタリング指標の200日線を組み合わせて,トレンドを効果的に追跡し,ほとんどの偽信号をフィルタリングできます.中価平均等パラメータを使用すると,価格の異常な変動による平均線への影響を軽減できます.
この戦略は,移動平均などの指標を単独で使用するよりも,トレンドの転換点をよりうまく捉え,そのため,タイミングでポジションを調整することができる.これは最大の利点である.
リスク分析
この戦略は主に一雲図指標の判断方向に依存し,一雲図自体は誤信号を生じます.判断が偏り出せば,この戦略は損失を引き起こす可能性があります.
さらに,パラメータ設定が不適切である場合,戦略の不良なパフォーマンスを引き起こします.変換線パラメータが短すぎると,偽信号が形成されやすい.ベースラインパラメータが長すぎると,追跡効果が悪くなる.バランスを取るためにパラメータ最適化が必要である.
最適化の方向
他の指標と組み合わせて信号の質を向上させることも考えられます.例えば,KDJ指標は,オーバーバイオーバーセール領域を判定して信号をフィルターする.または,ATR指標を使用してストップロスを設定する.
パラメータ面では,より敏感な取引信号を得るために,変換線パラメータを5日または7日などに調整するなど,より多くの組み合わせをテストすることができます.また,追跡効果をバランスするために,ベースラインパラメータを20日ほど変更するテストもできます.
また,特定の波動的な状況下では,戦略をオフにすることで,急激な市場の影響を回避することも考えられます.
要約する
この戦略は,トレンド判断と長期のフィルタリング指標の優位性を統合し,中長期のトレンドを効果的に追跡することができる.また,パラメータ設定と風力制御策も,誤信号と波動による影響を減らすために継続的に最適化する必要がある.全体的にこの戦略は,実際の操作価値がある.
- 1