デュアルトラックブレークスルー移動平均クロスオーバー戦略

概要
双軌突破均線交差戦略は,トレンド追跡型の量化取引戦略である.この戦略は,市場トレンドの方向を判断するために,均線交差信号を組み合わせて,入場を行うために,双軌メカニズムを使用する.具体的には,戦略は,異なる周期の平均を使用して双軌を構成し,価格突破上軌または下軌によってトレンドを判断する.そして,高速または遅い均線交差信号のフィルター入場タイミングと組み合わせる.
戦略原則
双線突破均線交差戦略は,主に以下の部分から構成される.
-
トレンド判断モジュール: 異なる周期平均線を用いて二線を構成し,価格が上線を突破すると上昇傾向と判断し,下線を突破すると下降傾向と判断する.
-
入学モジュール:速均線で中長線均線を横切るときは多めに,下着時に空いてください。同時にトレンド方向を判断する必要があります。
-
出場モジュール:速均線下を通過中長線均線時平仓。
戦略はまず,トレンドの強さを判断するために必要なトレンドの強さをTrend Requiredパラメータを使用して設定します. 価格が上線または下線を突破すると,トレンドとして判断されます. その後,高速平均線上での中長線平均線を突破すると,多入場を行います.
さらに,戦略には,止損・止<unk>モジュールがある.特定のパラメータは,リスクと利益を制御するために調整・最適化することができる.
優位分析
単線または単均線戦略と比較して,双線突破均線交差戦略は,トレンド判断と入場タイミングの選択を統合し,市場のリズムをよりよく把握することができます.具体的利点は:
-
ツインレールの設定は,トレンドを正確に判断し,機会を逃さないようにします.
-
均線交差フィルターは,偽突破が逆方向操作される確率を減らすことができる.
-
パラメータを調整してリスクとリターンを最適化できます.
-
戦略の論理はシンプルで明快で,分かりやすく,追跡しやすい.
リスク分析
双線突破均線交差策にはリスクもあります.
-
双軌道の設定は,トレンド判断の誤差の可能性を完全に回避することはできません.
-
平均線パラメータの設定を誤って設定すると,取引頻度が高すぎたり,操作が逆転したりする可能性があります.
-
ストップ・ロースの設定が緩やかすぎて,単発損失を効果的に制御できない.
対応方法は以下の通りです.
-
双線パラメータを調整し,突破判断の範囲を適切に緩和する.
-
取引頻度が合理的であることを保証する平均線周期ポートフォリオを最適化します.
-
異なるストップポイントレベルをテストし,最適なパラメータを見つけます.
最適化の方向
双線突破均線交差策には以下の改善策があります.
-
異なる均線周期パラメータをテストし,最適な組み合わせを見つける.
-
複数の均等な線を加え,複数の均等な線をフィルタリングするシステムを構築してみましょう.
-
トラッキングストップ,振動ストップなど,さまざまなストップアルゴリズムをテストする.
-
資金の利用効率を最適化するために,報酬メカニズムに加入する.
-
ブリン帯,KDJなど,他の指標と組み合わせたフィルタリングを行う.
要約する
双線突破均線交差戦略の総合は,トレンド判断と入場タイミングの選択を考慮し,市場のペースを効果的に把握できます.単一の指標と比較して,この戦略は,判断がより正確で,フィルタリングが優れているという特徴があります.パラメータ最適化とモジュールアップグレードにより,戦略の安定性と収益率をさらに向上させる見込みがあります.
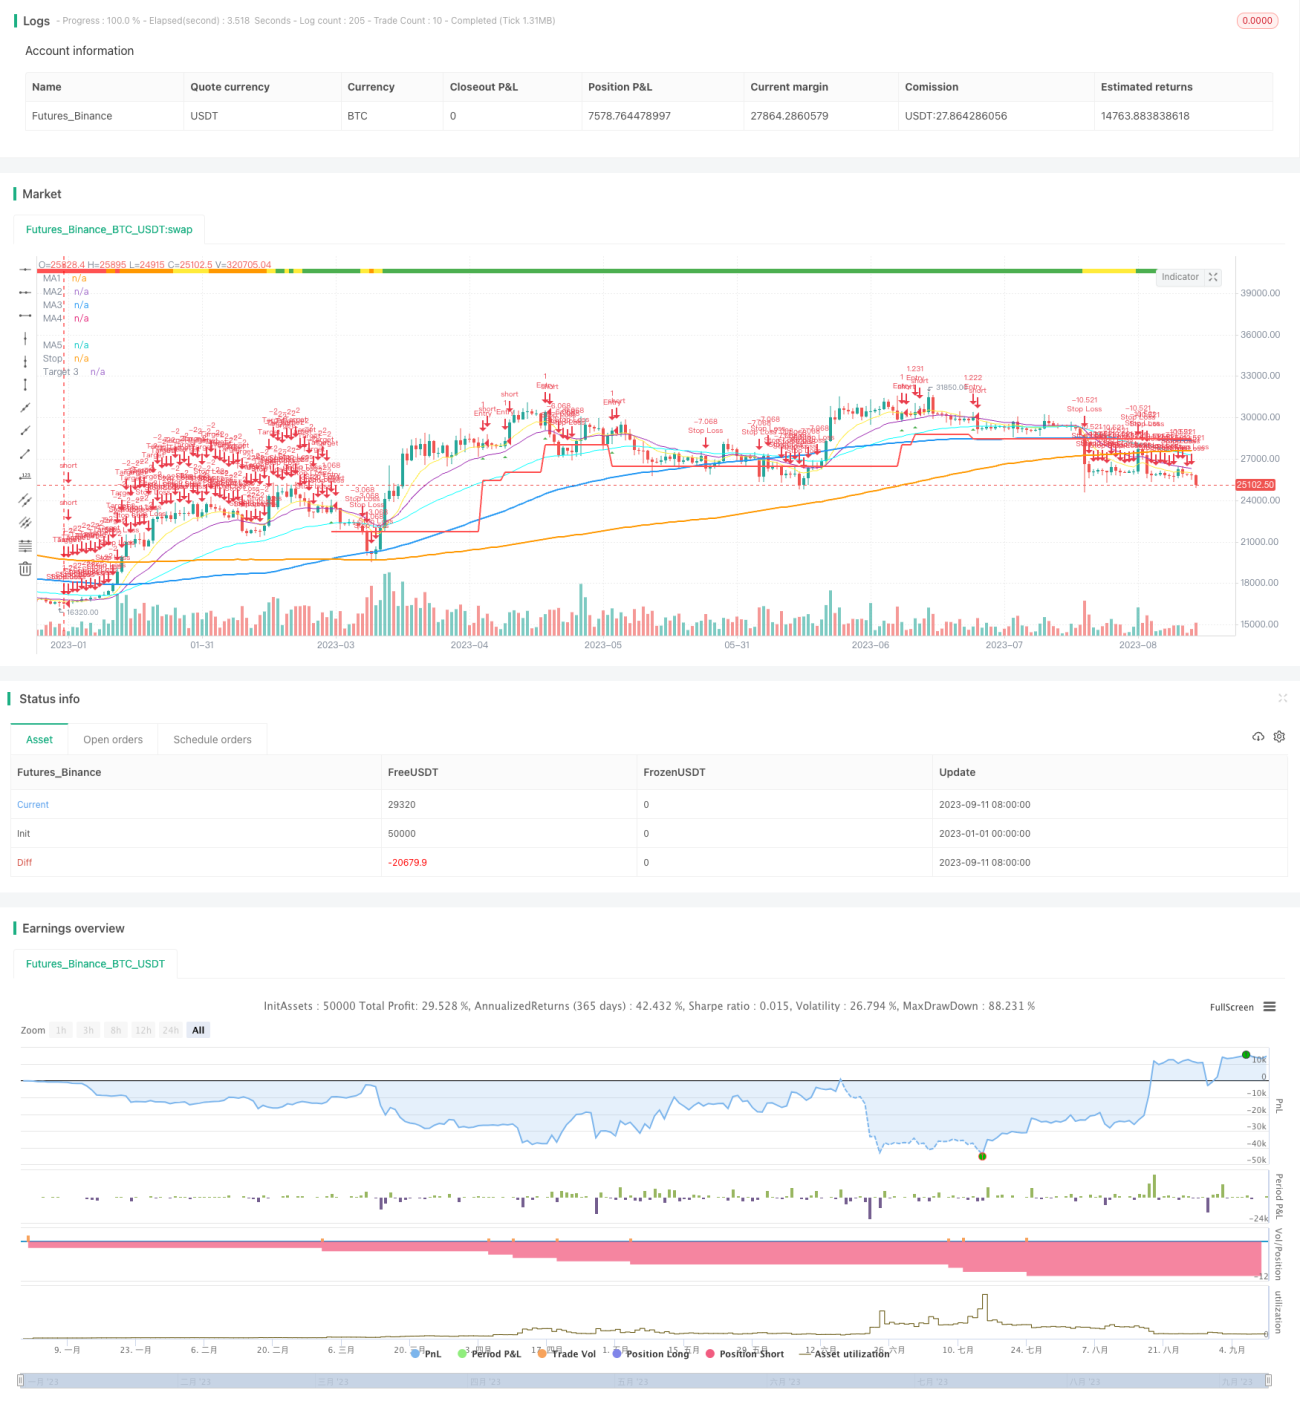
/*backtest
start: 2023-01-01 00:00:00
end: 2023-09-12 00:00:00
period: 1d
basePeriod: 1h
exchanges: [{"eid":"Futures_Binance","currency":"BTC_USDT"}]
*/

//@version=4
//Author = Dustin Drummond https://www.tradingview.com/u/Dustin_D_RLT/
//Strategy based in part on original 10ema Basic Swing Trade Strategy by Matt Delong: https://www.tradingview.com/u/MattDeLong/
//Link to original 10ema Basic Swing Trade Strategy: https://www.tradingview.com/script/8yhGnGCM-10ema-Basic-Swing-Trade-Strategy/- 1