日中取引のキーポイント戦略

1
Follow
1779
Followers
概要
これは,インドの日内取引のキーポイント戦略で,主要は,開場価格,最高価格,最低価格,および閉場価格を使用して,キーサポートとレジスタンスポイントを計算し,これらのポイントで価格の突破が発生したときに取引します.
戦略原則
- 前日の最高値,最低値,終値を計算する
- 主要なサポートポイントS1,レジスタンスポイントR1とキーポイントPPを公式で計算する
- 価格がこれらのピークを突破すると,オールまたはオフのポジションに入ります.
- ストップ・損失退出の仕組みを設定する
主要なキーポイントの計算式は以下の通りである.
PP = (最高价+最低价+收盘价)/3
R1 = 2*PP - 最低价
S1 = 2*PP - 最高价
優位分析
- 重要なポイントを活用して,高い確率のブレイクポイントを提供して,利益の機会を拡大する
- 取引のルールは明確で,ポイントは簡単です.
- ストップポイントは簡単に設定でき,リスクを効果的にコントロールできます.
リスク分析
- 重要なポイントで偽突破が起こり,損失を招く可能性
- キーポイントの有効性は 検証が必要で 必ずしも有効とは限らない
- ストップポイントの不適切な設定により損失が拡大する可能性があります.
リスク対策:
- combining with other indicators to filter false breakouts
- backtesting to validate strategy over long timeframes
- optimize stop loss placement
最適化の方向
- 他の技術指標と組み合わせた偽突破信号のフィルタリング
- 種別パラメータに最適化
- 動的調整ストップポイント
要約する
この戦略は,全体的に簡潔で直接的で,歴史データによって容易に有効性を検証できる. 策として,一日の取引戦略として,それは,鍵点を利用して高確率の突破口を提供することで,良い結果を得ることができる. しかし,鍵点を依存しているため,ある種の偽の突破口のリスクも存在し,これを減らすためにさらなる最適化が必要である. 全体として,これは,リスクが制御可能な,実行しやすい一日の取引戦略である.
Source
Pine
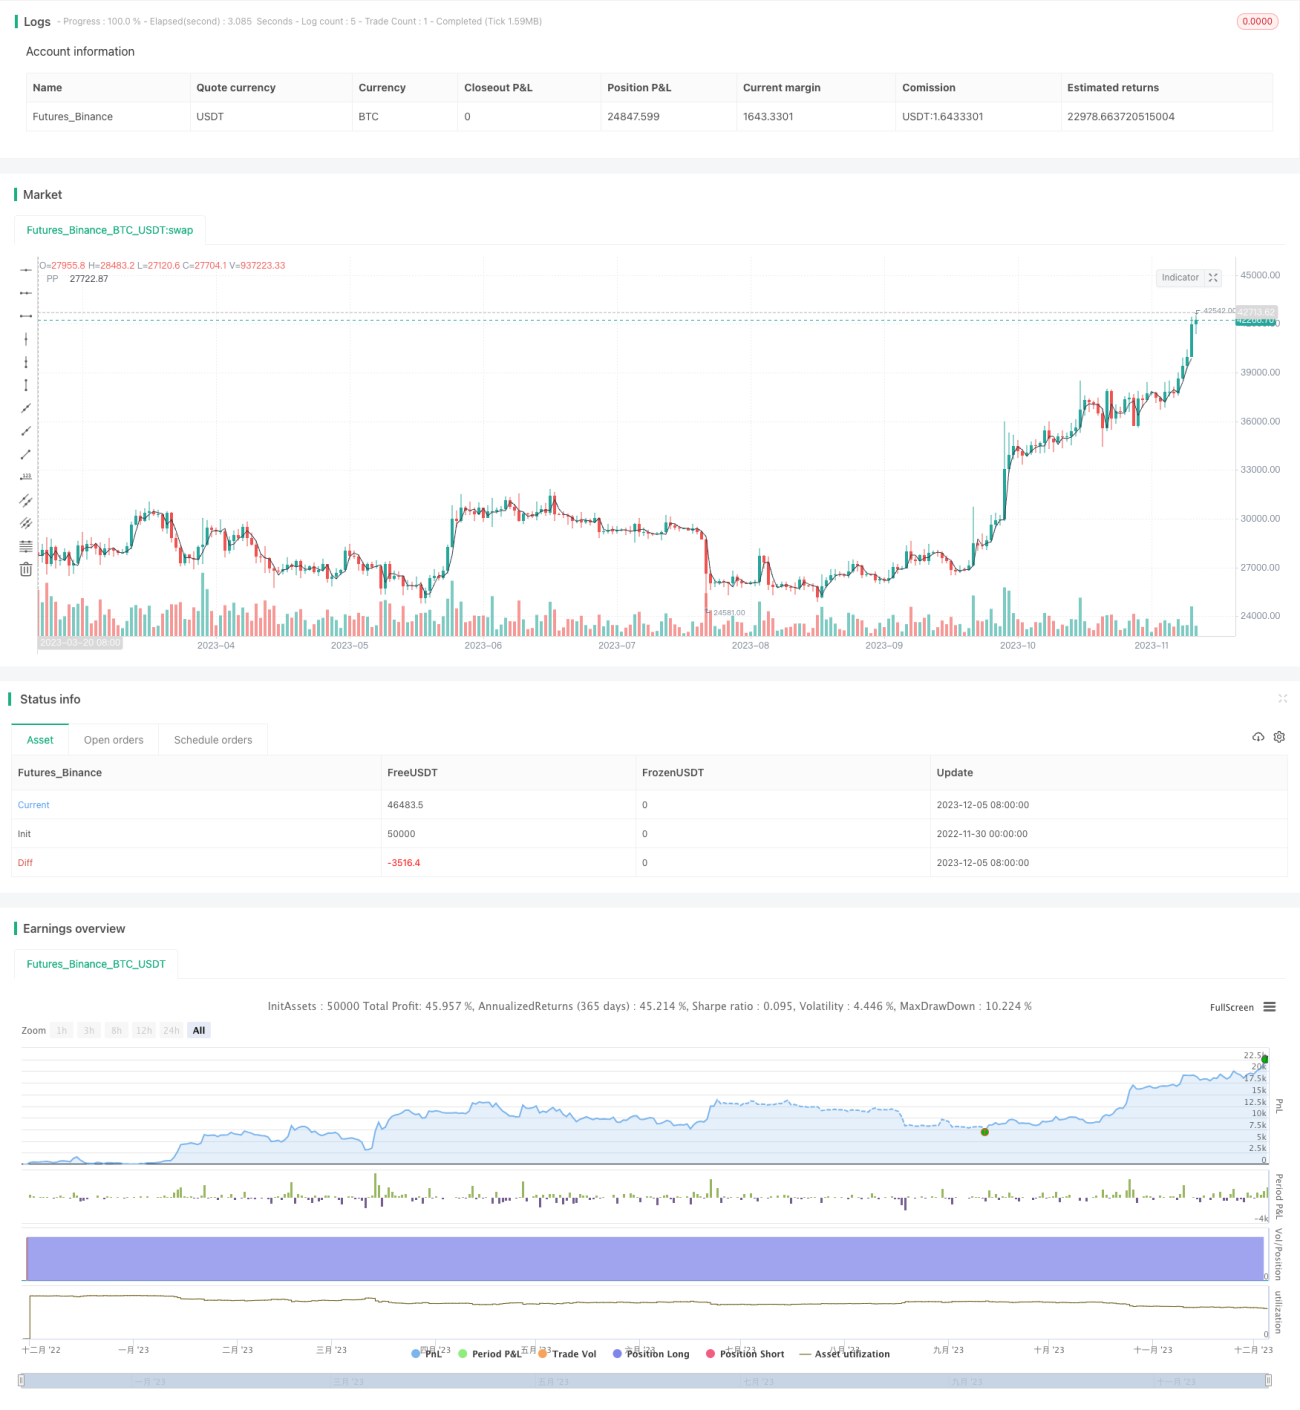
/*backtest
start: 2022-11-30 00:00:00
end: 2023-12-06 00:00:00
period: 1d
basePeriod: 1h
exchanges: [{"eid":"Futures_Binance","currency":"BTC_USDT"}]
*/

// This source code is subject to the terms of the Mozilla Public License 2.0 at https://mozilla.org/MPL/2.0/
// © arameshraju
//Reference credit goes to All
Strategy parameters
Related strategies
Comment
All comments (0)
No data
- 1