移動平均集計ウィリアムズ事業エリアの売買圧力指標戦略

この戦略の主な考えは,ウィリアムズ商用区の買賣圧力の指数を使って市場の累積と分配の段階を判断し,価格とウィリアムズ指数との間の偏差を発見し,取引信号を生成することである.安全な資産が新しい高を創造したが,ウィリアムズ指数が新しい高を創造しなかったとき,賭博参加者を代表して分配し,売るべきである.安全な資産が新しい低を創造したが,ウィリアムズ指数が新しい低を創造しなかったとき,賭博参加者を代表して蓄積し,買るべきである.
戦略の原則は以下の通りです.
この戦略は,ウィリアムズ商店街の買賣圧力の指標を基に,市場の買賣圧力を反映し,市場が買い手または売り手によって支配されていることを判断する.ウィリアムズ指標は,閉店価格,最高価格および最低価格を計算することによって,価格の蓄積と分配を判断する.価格が革新的だが,ウィリアムズ指標は革新的ではない高い,分配を代表し,売るべきである.価格が革新的だが,ウィリアムズ指標は革新的ではない低,蓄積を代表し,購入を代表する.
この戦略は,価格の偏差を検出し取引シグナルを生成するために,市場の蓄積と分配を判断するために,ウィリアムズ指数を使用する. 同時に,移動平均を使用してウィリアムズ指数を平らげ,誤ったシグナルを回避する. ウィリアムズ指数が移動平均より高い場合は,蓄積段階;移動平均より低い場合は,分配段階. 偏差が検出された場合,長期ポジションは,分配段階で売却され,蓄積段階で購入される. 短いポジションは,その逆である.
この戦略の主な利点は
-
市場における買取・売買の圧力を正確に判断し,価格動向の転換点を捉えることができる.
-
移動平均を用いて指標曲線を平坦化して,誤った信号を生じさせないようにする.
-
規則は明快でわかりやすく,実行しやすい.
-
柔軟に調整できるパラメータ,異なる市場環境に適用する.
主なリスクと解決策は以下の通りです.
-
ウィリアムズ指数は誤信号を発生させることがあり,移動平均は,この問題をある程度軽減する.
-
パラメータが正しく設定されていない場合,価格転換を逃したり,偽信号を生成したりする可能性があります. パラメータを異なる周期に適応するように調整する必要があります.
-
緊急事態が価格に及ぼす影響に注意し,必要に応じて取引計画を中止する.
この戦略は,以下の方向に最適化できます.
-
複数のパラメータの組み合わせをテストし,最適なパラメータを探します.
-
他の技術指標を組み合わせて,信号の正確性を向上させる.
-
損失を抑える戦略を導入し,単一損失を削減する.
-
市場がより明確になったときに,市場に入ることを最適化します.
全体として,この戦略は,ウィリアムズ商用区の買賣圧力の指標を使用して,市場ゲーム参加者の意思を判断し,移動平均と組み合わせて価格偏差を発見し,取引信号を生成する.この戦略は,容易に理解して実施し,パラメータを調整して異なる市場に適用し,多方面での最適化も可能であり,深入な研究と適用に値する.
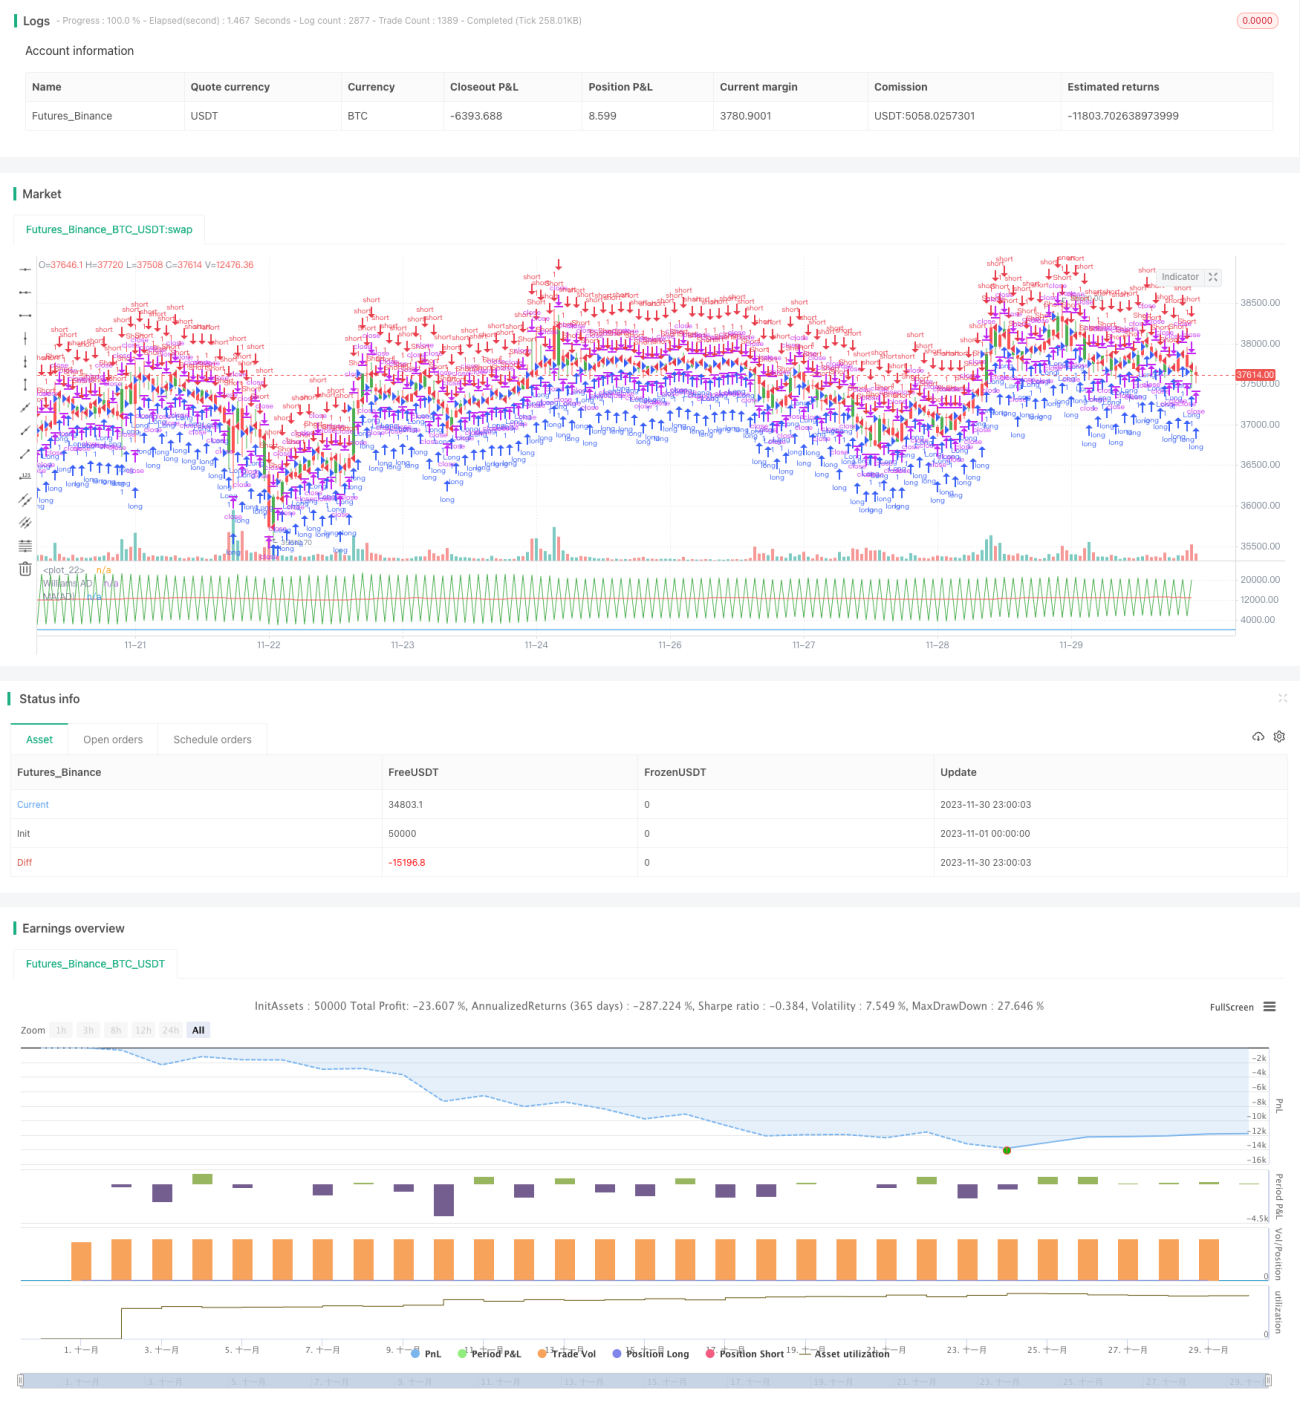
/*backtest
start: 2023-11-01 00:00:00
end: 2023-11-30 23:59:59
period: 1h
basePeriod: 15m
exchanges: [{"eid":"Futures_Binance","currency":"BTC_USDT"}]
*/

//@version=2
////////////////////////////////////////////////////////////
//  Copyright by HPotter v1.0 23/01/2018
// Accumulation is a term used to describe a market controlled by buyers;- 1