SMAボラティリティ偏差取引戦略

1
Follow
1778
Followers
SMAボラティリティ偏差取引戦略
戦略概要
この戦略は,シンプルな移動平均といくつかの数学的な計算を使用して,買い/売却のポイントを決定します. 100日SMAを基準線として使用します. 閉盘価格がこのラインより低ければ,その線より低い程度に基づいて開店ポイントを選択します. この値は (低偏移量) 構成可能なパーセントです.
戦略原則
この戦略は,3つのSMA線を使用します. 快線 (デフォルトで14日),慢線 (デフォルトで100日),参照線 (デフォルトで30日).
閉盤価格が基準線より低いとき,そして慢線に対する低偏移が配置された低偏移より大きいとき,そして快線が上がり,慢線が下がり,多頭に入ります。これらの条件を満たすと,快線と慢線が交差する可能性が非常に高いので,良い入場点です。
閉盘価格が参照線より高く,慢線に対する高偏移が配置された高偏移より大きいとき,閉盘価格が連続3K線で上昇し,利益が実現し,快線が慢線より高いとき,平仓多単.価格が大きく上昇し続けると,追跡ストップが起動する.
各取引のポジションは,権利利権の一定比率に基づいて入って,この方法でポジションをコントロールする.
戦略的優位分析
- 価格曲線を平らにするためのSMAの優位性を活用し,市場騒音をフィルターします.
- SMAクロスには一定のトレンド予測能力があります.
- SMA線に対する偏移量設定で,偽突破を避ける.
- トレンドとクロスインジケーターを組み合わせて,意思決定の正確さを向上させる.
- ストップ・ローズ・トラッキングを利用して収益を固定し,撤回を回避する.
戦略的リスク分析
- 価格の転換点を逃す可能性が高い.
- 偏移量設定が不適切である場合,偏移量設定が不適切である場合,偏移量設定が不適切である場合,偏移量設定が不適切である場合,偏移量設定が不適切である場合.
- トラッキングストップパラメータの設定が不適切である場合,早すぎるストップまたは過剰なストップが発生する可能性があります.
- 価格の急激な変動に対応できない市場.
対応する最適化策
- 他の先行指標と組み合わせた入場フィルター
- 偏移量に対する反復テスト最適化.
- 止損パラメータを反復テストし,最適パラメータを見つけます.
- 高波動期にポジションを下げること.
戦略最適化の方向性
- 異なる周期のSMAをテストし,最適なパラメータを探します.
- 市場構造とトレンドを判断する他の指標に追加
- ストップ・ローズ・パラメータを最適化して,より多くの収益をロックします.
- 市場変動に応じてポジションの調整
- 複数の品種に適用し,組み合わせる
要約する
SMA波動偏移取引戦略は,偏移を異なるSMA平均線に参照して設定し,最適な入場時間を探す.同時に,退出機構は,止損を追跡して利益をロックする.この戦略は,簡単に理解し,簡単に実施できます.SMAパラメータ,偏移設定,止損水平を最適化することによって,よりよい効果を得ることができます.この戦略は,中長期周期で安定した利益を追求する投資家に適しています.
Source
Pine
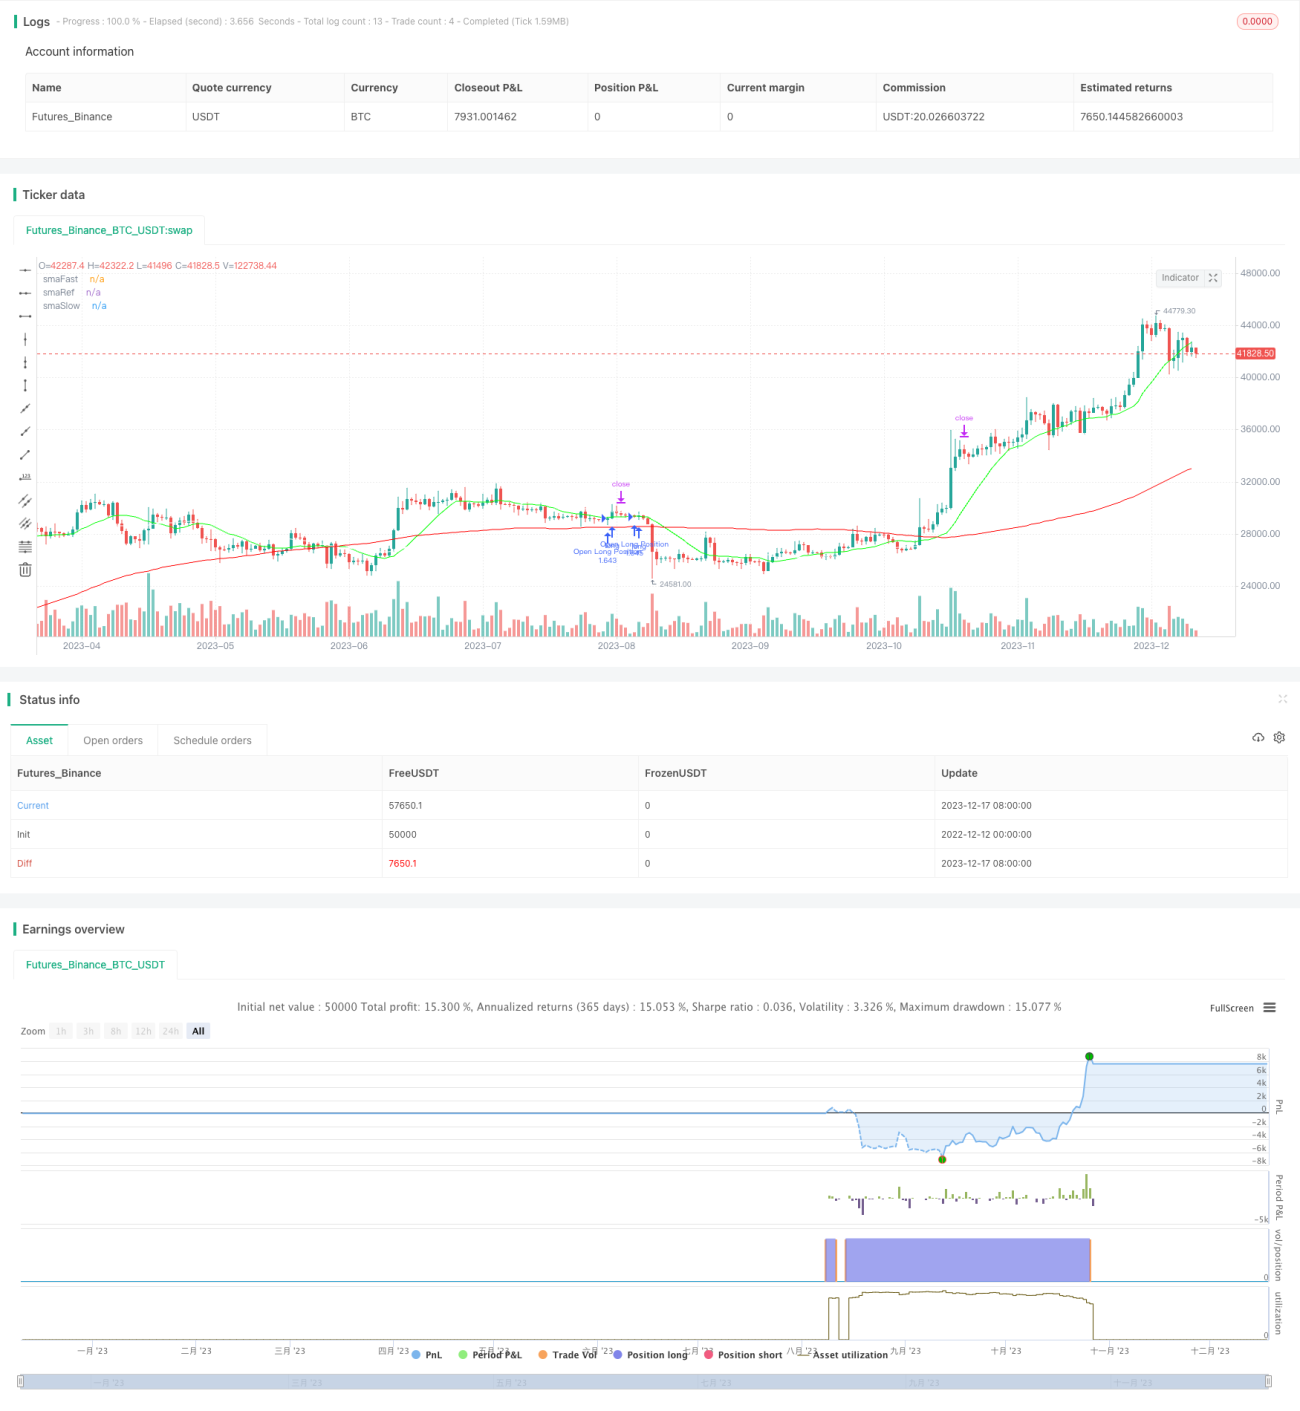
/*backtest
start: 2022-12-12 00:00:00
end: 2023-12-18 00:00:00
period: 1d
basePeriod: 1h
exchanges: [{"eid":"Futures_Binance","currency":"BTC_USDT"}]
*/

// @version=4
// Author: Sonny Parlin (highschool dropout)
strategy(shorttitle="SMA+Strategy", title="SMA Offset Strategy",
overlay=true, currency=currency.USD,Strategy parameters
Related strategies
Comment
All comments (0)
No data
- 1