レインボーオシレーターバックテスト戦略
作成日:
2023-12-26 15:08:17
最終変更日:
2023-12-26 15:08:17
コピー:
4
クリック数:
888
1
フォロー
1750
フォロワー
概要
虹の振動器反測戦略は,虹の振動器指標に基づく量的な取引戦略である.この戦略は,株価と平均線との間の偏差を計算し,市場のトレンドの方向と強さを判断し,それによって長短ポジションの方向を判断する.
戦略原則
この戦略の核心指標は,虹の振動器 (Rainbow Oscillator,RO) で,計算式は以下の通りである.
RO = 100 * ((收盘价 - 10日移动平均线) / (最高价的最高值 - 最低价的最低值))
その10日移動平均は10周期の閉盘価格の単純な移動平均である.この指標は,価格が自平均線から偏っている状況を反映している.RO>0であるときは,価格が平均線上にあることを代表し,看板信号である.RO であるときは,価格が平均線下にあることを代表し,看板信号である.
この策略は,補助指標である帯域幅 ((Bandwidth,RB) を計算し,計算式は以下のとおりである.
RB = 100 * ((均线的最高值 - 均线的最低值) / (最高价的最高值 - 最低价的最低值))
RBは平均線間の幅を表している。RBが大きいほど,価格の変動が大きいことを示し,逆に価格は安定している。RB指標は市場の安定度を判断するために使用できる。
ROとRBの指標の値に基づいて,この戦略は価格偏差の程度と市場の安定性を判断し,長ポジションと短いポジションの取引シグナルを生成する.
戦略的優位性
この戦略の利点は以下の通りです.
- 単一の指標の判断の制限を回避する双重指標の判断に基づいています.
- 価格の動向と市場の安定性を同時に判断できる.
- 計算はシンプルで,理解し,実行しやすい.
- 視覚的な指標で,虹の効果を生み出し,直感的に読みやすい.
戦略リスク
この戦略にはいくつかのリスクがあります.
- ROとRBの指標パラメータを正しく設定しないことは,取引信号のエラーを引き起こす可能性がある.
- 双対対策は誤信号と頻繁な取引を容易にする.
- 採集周期と品種選択の不適切さは戦略の効果に影響する.
- 取引コストを考慮しない限り,CDの効果はあまり良くありません.
対策として
- ROとRBのパラメータを最適化する.
- フィルタリング条件を追加し,頻繁に取引を避ける.
- 適した回転周期と品種を選択する.
- 取引コストを計算して考慮する.
戦略の最適化
この戦略は,以下の点で最適化できます.
- RO指数にSmooth機能を追加し,指数の急激な波動を回避する.
- 単一損失をコントロールするストップ・ローズ戦略に参加する.
- 他の指標と組み合わせた取引により,利得の確率を高めます.
- 機械学習モデルの追加で予測し,指標の効果を判断する.
- 異なる品種のパラメータに最適化して適応性を向上させる.
要約する
虹の振動器反測戦略は,価格と平均線との偏差関係を計算して,市場の傾向と安定性を判断し,そのため長短ポジション取引を行う.この戦略は,直感的に読みやすい,実装がシンプルで,一定の実用価値がある.しかし,いくつかのリスクも存在し,パラメータと取引ルールに合わせて最適化する必要があり,リスクを低減し,実績を向上させる.
ストラテジーソースコード
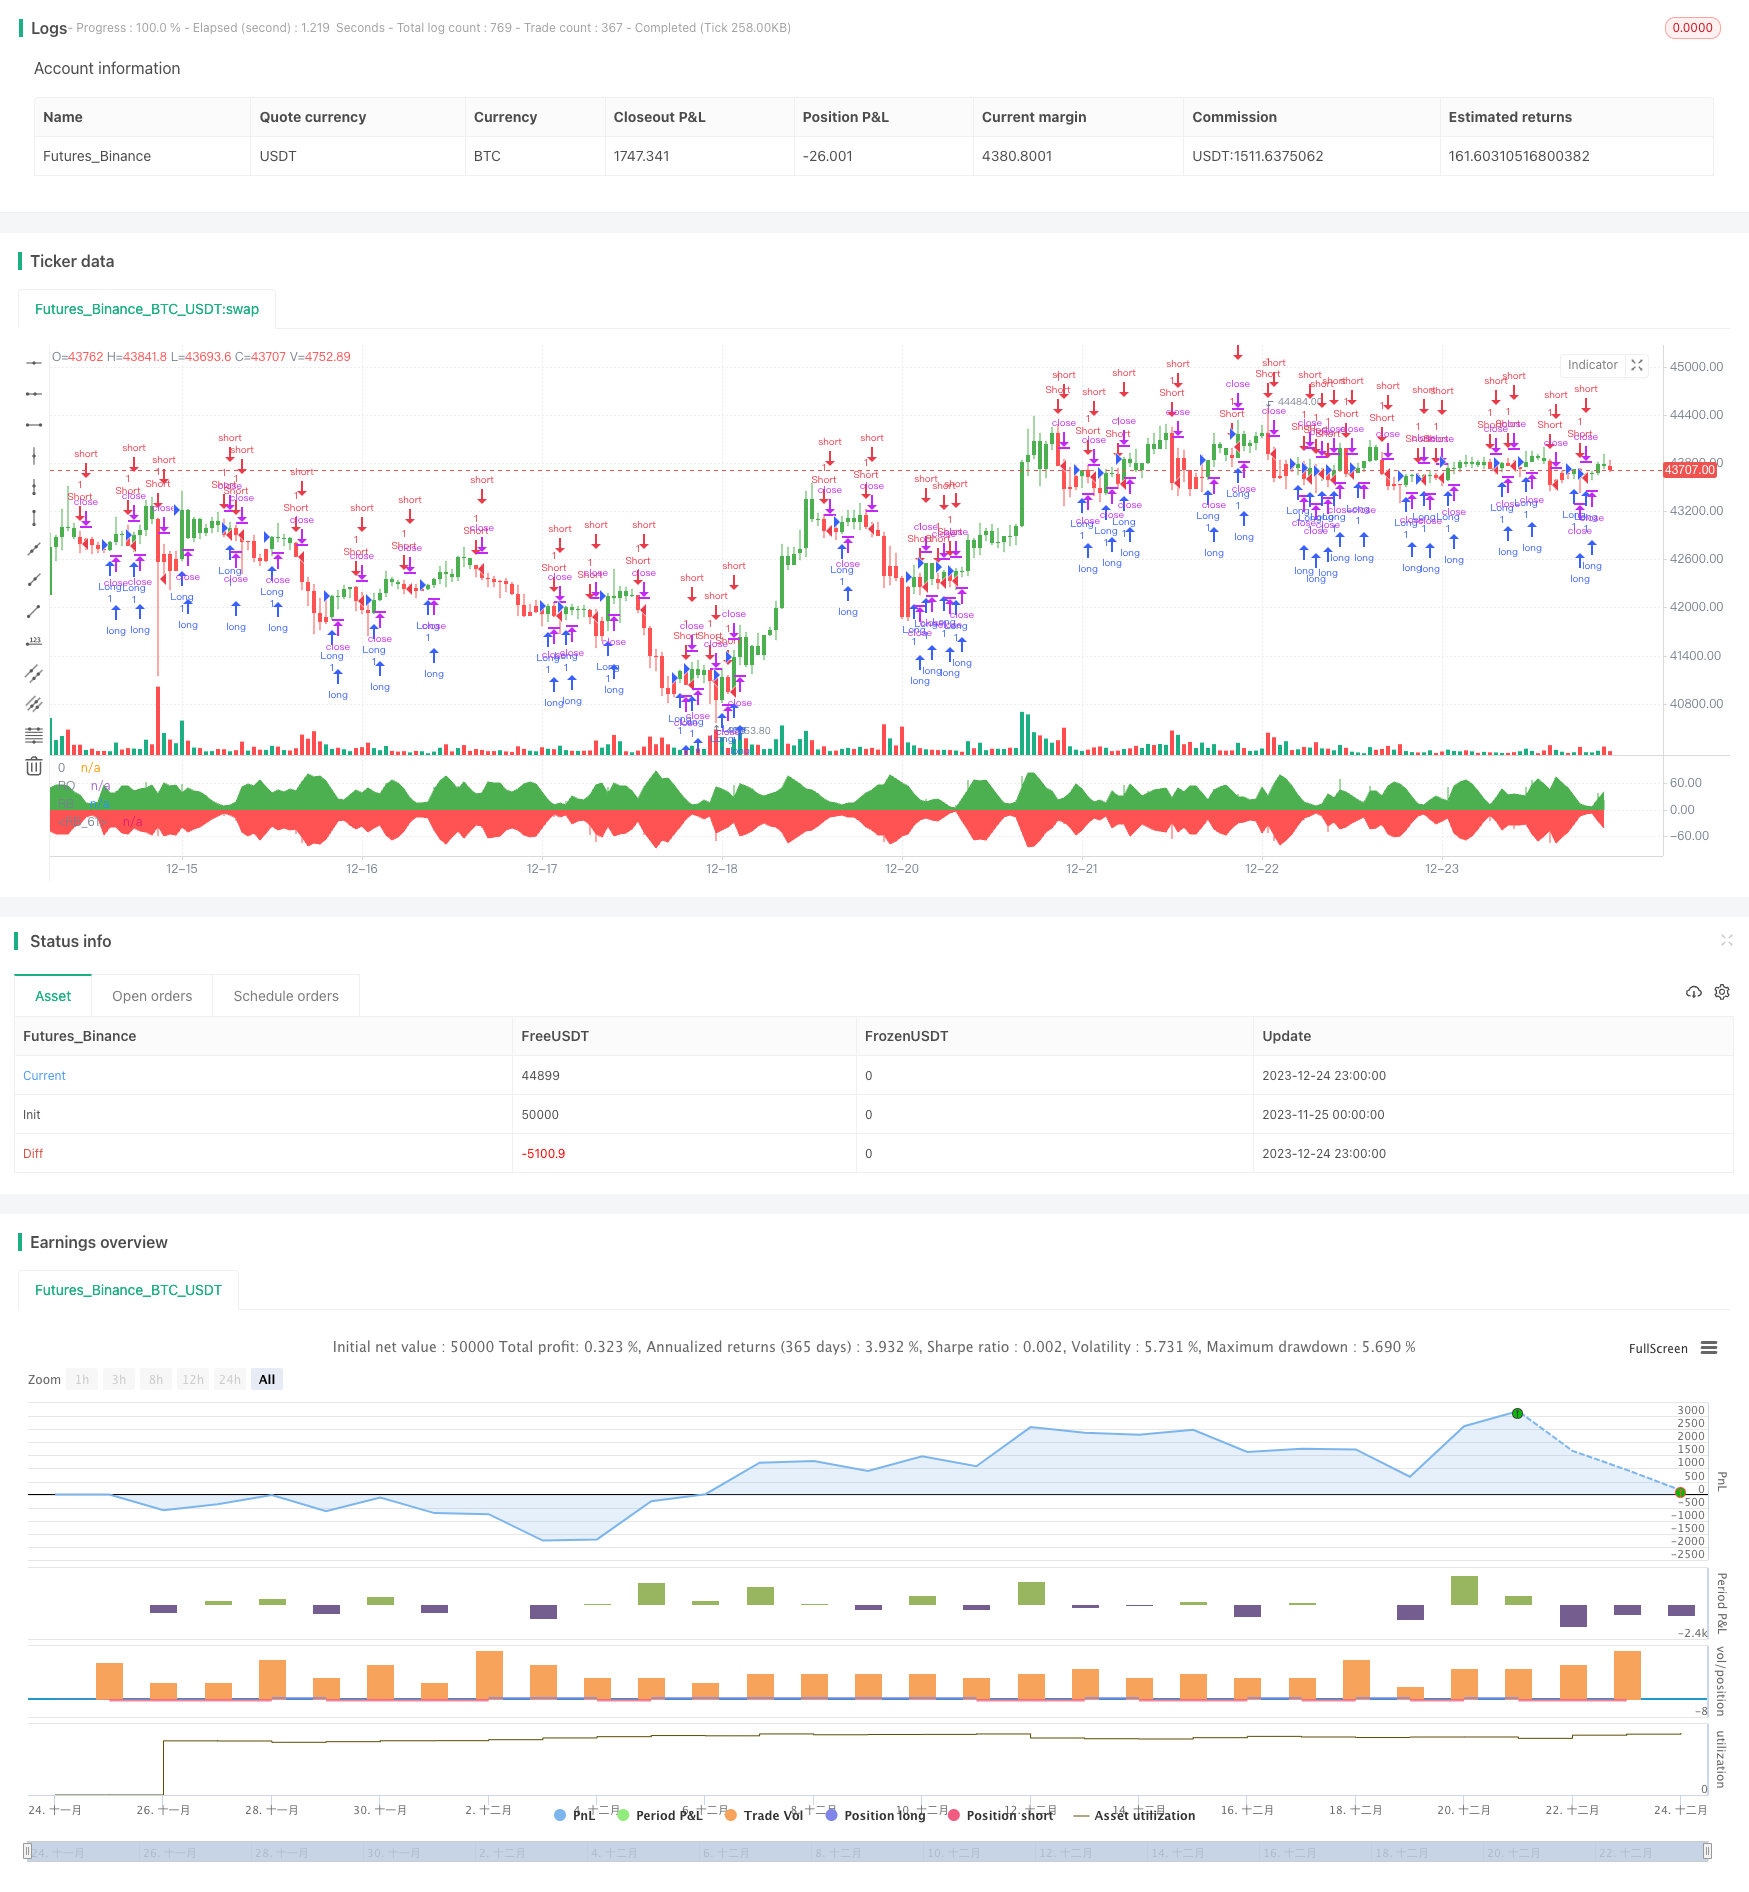
/*backtest
start: 2023-11-25 00:00:00
end: 2023-12-25 00:00:00
period: 1h
basePeriod: 15m
exchanges: [{"eid":"Futures_Binance","currency":"BTC_USDT"}]
*/

//@version=2
////////////////////////////////////////////////////////////
//  Copyright by HPotter v1.0 18/03/2018
// Ever since the people concluded that stock market price movements are not
// random or chaotic, but follow specific trends that can be forecasted, they
// tried to develop different tools or procedures that could help them identify
// those trends. And one of those financial indicators is the Rainbow Oscillator
// Indicator. The Rainbow Oscillator Indicator is relatively new, originally
// introduced in 1997, and it is used to forecast the changes of trend direction.
//
// As market prices go up and down, the oscillator appears as a direction of the
// trend, but also as the safety of the market and the depth of that trend. As
// the rainbow grows in width, the current trend gives signs of continuity, and
// if the value of the oscillator goes beyond 80, the market becomes more and more
// unstable, being prone to a sudden reversal. When prices move towards the rainbow
// and the oscillator becomes more and more flat, the market tends to remain more
// stable and the bandwidth decreases. Still, if the oscillator value goes below 20,
// the market is again, prone to sudden reversals. The safest bandwidth value where
// the market is stable is between 20 and 80, in the Rainbow Oscillator indicator value.
// The depth a certain price has on a chart and into the rainbow can be used to judge
// the strength of the move.
//
// You can change long to short in the Input Settings
// WARNING:
//  - For purpose educate only
//  - This script to change bars colors.
////////////////////////////////////////////////////////////
strategy(title="Rainbow Oscillator Backtest")
Length = input(2, minval=1)
LengthHHLL = input(10, minval=2, title="HHV/LLV Lookback")
reverse = input(false, title="Trade reverse")
xMA1 = sma(close, Length)
xMA2 = sma(xMA1, Length)
xMA3 = sma(xMA2, Length)
xMA4 = sma(xMA3, Length)
xMA5 = sma(xMA4, Length)
xMA6 = sma(xMA5, Length)
xMA7 = sma(xMA6, Length)
xMA8 = sma(xMA7, Length)
xMA9 = sma(xMA8, Length)
xMA10 = sma(xMA9, Length)
xHH = highest(close, LengthHHLL)
xLL = lowest(close, LengthHHLL)
xHHMAs = max(xMA1,max(xMA2,max(xMA3,max(xMA4,max(xMA5,max(xMA6,max(xMA7,max(xMA8,max(xMA9,xMA10)))))))))
xLLMAs = min(xMA1,min(xMA2,min(xMA3,min(xMA4,min(xMA5,min(xMA6,min(xMA7,min(xMA8,min(xMA9,xMA10)))))))))
xRBO = 100 * ((close - ((xMA1+xMA2+xMA3+xMA4+xMA5+xMA6+xMA7+xMA8+xMA9+xMA10) / 10)) / (xHH - xLL))
xRB = 100 * ((xHHMAs - xLLMAs) / (xHH - xLL))
clr = iff(xRBO >= 0, green, red)
pos = iff(xRBO > 0, 1,
       iff(xRBO < 0, -1, nz(pos[1], 0)))
possig = iff(reverse and pos == 1, -1,
          iff(reverse and pos == -1, 1, pos))
if (possig == 1)
    strategy.entry("Long", strategy.long)
if (possig == -1)
    strategy.entry("Short", strategy.short)
barcolor(possig == -1 ? red: possig == 1 ? green : blue )
plot(xRBO, color=clr, title="RO", style= histogram, linewidth=2)
p0 = plot(0, color = gray, title="0")
p1 = plot(xRB, color=green, title="RB")
p2 = plot(-xRB, color=red, title="RB")
fill(p1, p0, color=green)
fill(p2, p0, color=red)