ボリンジャーバンドのゴールデンクロスとデッドクロスの定量戦略(取引ペア全体)
概要
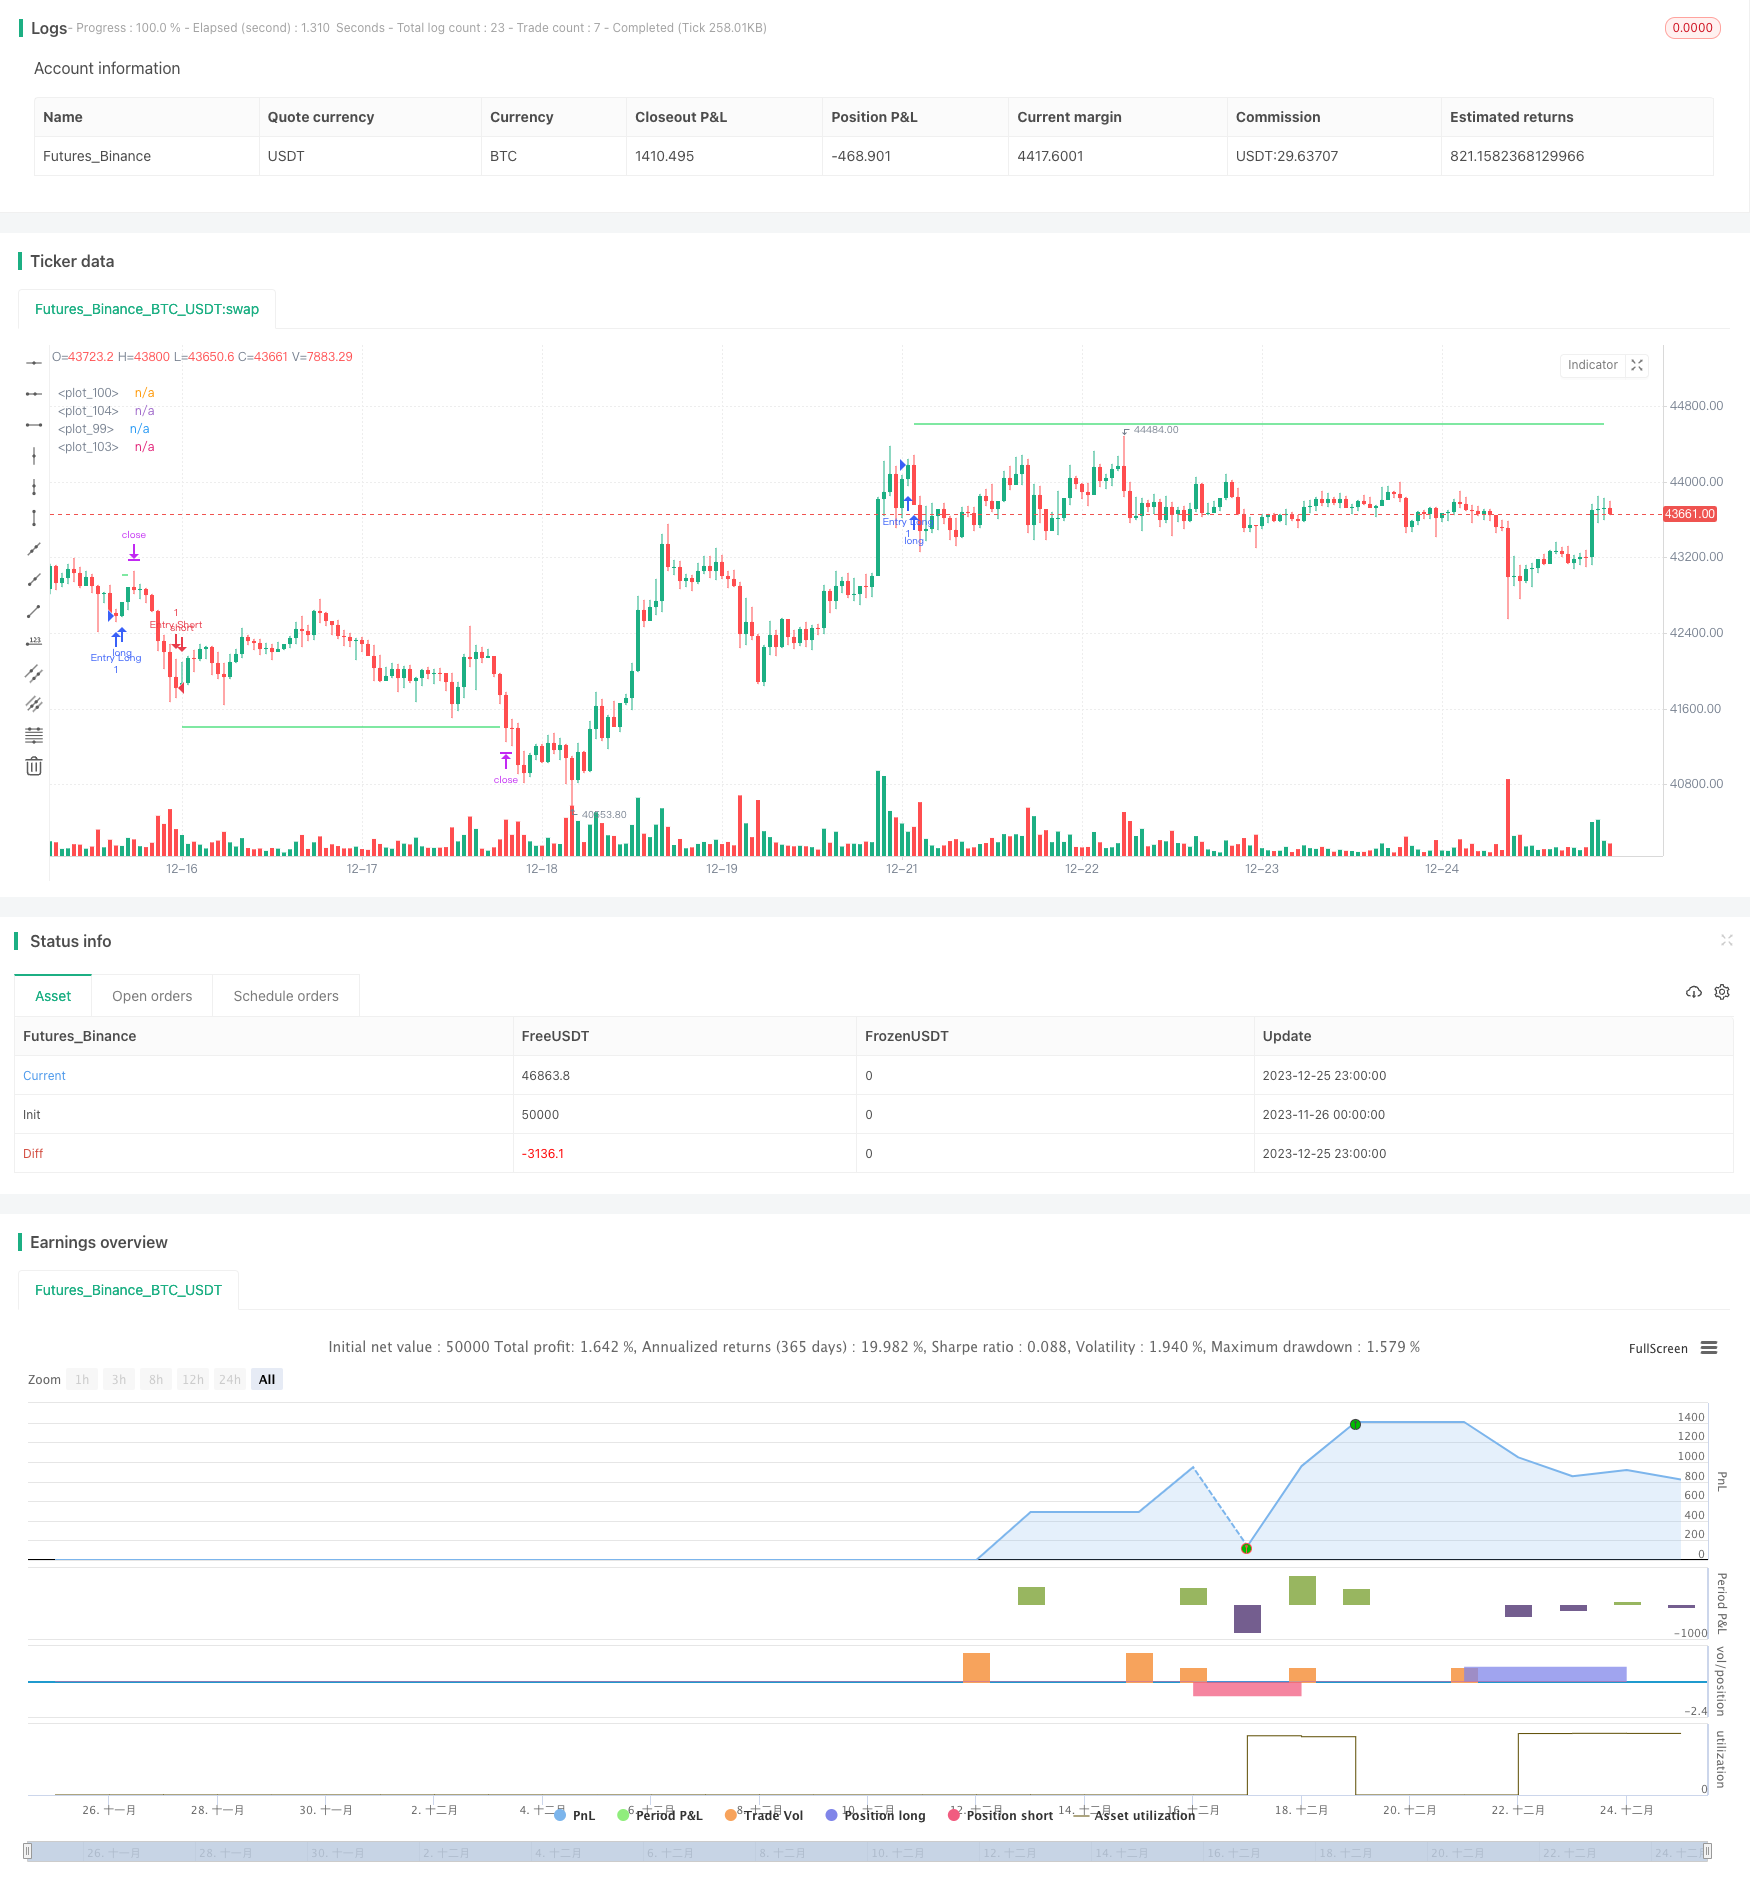
この戦略は,MACD指標の快線と慢線の交差を比較して,買入と売却の信号を生成する.買入の信号が生成される時,口座権益を一定比例占め,買入を行う.その後,特定の引き上げ点でポジションを追加する.ポジションの利益が配置の止まり点に達したときに,全ポジションを平売りする.売り出し信号と買入信号の論理は類似する.
戦略原則
この戦略の核心的な論理は,トレンドを判断するためにMACDの快線と慢線の交差を比較することです.MACDは,短期と長期の平均の間の差を計算することによって,市場の傾向とエネルギーを判断するための移動平均の差値です.快線と慢線の交差は金叉と死叉です.
快線上では慢線を突破すると金叉が生じ,市場が看板傾向にあることを示す.このとき,戦略はポジションを多く開く.快線下では慢線を突破すると死叉が生じ,看板傾向を示す.このとき,戦略はポジションを空にする.
ポジション開設後,戦略は特定の撤回点で追加または空白のポジションを行う.これは,マーティンゲル原理によって収益のスペースを増やすことができる.ポジションの累積収益が配置のストップポイントに達した後に,戦略は全部を売り,または平仓を購入する.
優位分析
この戦略は以下の利点があります.
市場動向を判断するために,MACD指数は,古典的で信頼できる技術分析指標である.
取引のリスクは1つの取引でコントロールできます.
追加開設により,マーティンゲル原理により収益の余地が拡大できる.
ストップポイントを配置して損失を制限する.
リスク分析
この戦略にはいくつかのリスクがあります.
MACD指数は市場の動きを完璧に予測できないので,誤ったシグナルが発生する可能性があります.
全ポジションの追加ポジションは,撤回拡大のリスクがある。追加されるポジションの割合を適切に調整することができる。
止境点設定が小さすぎると,のスペースが制限される可能性があります.異なる品種に応じて調整できます.
各種取引が口座制限を超えないように,開設資金の割合を合理的に配置する必要があります.
最適化の方向
この戦略は以下の点で最適化できます.
異なるパラメータのMACD指標をテストし,特定の取引品種により適した指標パラメータを見つけます.
ポジションの追加と撤回の幅のパラメータを最適化して,最適なパラメータの組み合わせを見つけます.
長線と短線の操作停止点パラメータをそれぞれテストし,最適の停止レベルを決定する.
アカウントの加減能力を評価し,合理的な単一品種の最大ポジション制限を設定します.
ストップロジックを増やす. 市場が急激に変化したとき,ストップロジックは損失を効果的に制御する.
要約する
この戦略は,全体として典型的なトレンド追跡戦略である.市場トレンドの方向性を判断するためにMACD指標を使用し,バッチリ加仓の方法でトレンドを追跡し,収益が一定のレベルに達した後に停止して退場する.この戦略は,シンプルで実用的で,容易に実装され,量化取引の初心者にとって適しています.パラメータ最適化と風力制御ロジック拡張により,戦略をより堅牢にすることができます.
/*backtest
start: 2023-11-26 00:00:00
end: 2023-12-26 00:00:00
period: 1h
basePeriod: 15m
exchanges: [{"eid":"Futures_Binance","currency":"BTC_USDT"}]
*/

// This source code is subject to the terms of the Mozilla Public License 2.0 at https://mozilla.org/MPL/2.0/
// © TradingSoft_tech

//@version=5
strategy("MAPM-V1", overlay=true, default_qty_value=10, max_bars_back=5000,default_qty_type = strategy.percent_of_equity, commission_value=0.1, initial_capital = 100, pyramiding=6, currency=currency.USD)

///////// Options
SignalFast = input.int(300, step=10)
SignalSlow = input.int(600, step=10)
StepAddPurchases = input.float(2.5, step=0.1)
VolumePurchases = input.int(6,step=1)
Buy = input(true)
Sell = input(true)
longProfitPerc = input.float(title="Long Take Profit (%)", minval=0.0, step=0.1, defval=1) * 0.01
shortProfitPerc = input.float(title="Short Take Profit (%)", minval=0.0, step=0.1, defval=1) * 0.01
Martingale = input.float(1.6, minval = 1, step = 0.1)
VolumeDepo = input.int(100, step=1)
PercentOfDepo = input.float(10, step=1)
Close = (close)
EnterVolume = VolumeDepo*PercentOfDepo*0.01/Close

///////// Calculation indicator
fastAverage = ta.ema(close, 8)
slowAverage = ta.ema(close, 49)
macd = fastAverage - slowAverage
macdSignalF = ta.ema(macd,SignalFast)
macdSignalS = ta.ema(macd,SignalSlow)

// Test Start
startYear = input(2005, "Test Start Year")
startMonth = input(1, "Test Start Month")
startDay = input(1, "Test Start Day")
startTest = timestamp(startYear,startMonth,startDay,0,0)

//Test End
endYear = input(2050, "Test End Year")
endMonth = input(12, "Test End Month")
endDay = input(30, "Test End Day")
endTest = timestamp(endYear,endMonth,endDay,23,59)

timeRange = time > startTest and time < endTest ? true : false

///////// Plot Data
//plot(macd, style = plot.style_histogram)
//plot(macdSignalF*10000, style = plot.style_line, color=color.red)
//plot(macdSignalS*10000, style = plot.style_line, color=color.blue)
//plot(fastAverage, style = plot.style_line, color=color.red)
//plot(slowAverage, style = plot.style_line, color=color.blue)

///////// Calculation of the updated value
var x = 0.0
if strategy.opentrades>strategy.opentrades[1]
    x := x + 1
else if strategy.opentrades==0
    x := 0
y = x+1

///////// Calculation of reference price data
entryPrice = strategy.opentrades==0? 0 : strategy.opentrades.entry_price(0)
limitLong = strategy.position_avg_price * (1 + longProfitPerc)
limitShort = strategy.position_avg_price * (1 - shortProfitPerc)
SteplimitLong = entryPrice[0]*(1-StepAddPurchases*y/100)
SteplimitShort = entryPrice[0]*(1+StepAddPurchases*y/100)

///////// Conditions for a long
bool EntryLong = ta.crossover(macdSignalF, macdSignalS) and Buy and strategy.opentrades==0 and strategy.position_size==0
bool PurchasesLong = Buy and strategy.opentrades==x and strategy.position_size>0 and x<=VolumePurchases
bool CancelPurchasesLong = strategy.position_size==0 and strategy.opentrades==0
bool TPLong = strategy.position_size>0 and strategy.opentrades!=0
///////// Entry Long + add.purchases + cancel purchases + Take profit Long
switch
    EntryLong => strategy.entry("Entry Long", strategy.long, qty = EnterVolume)
    PurchasesLong => strategy.entry("PurchasesLong", strategy.long, qty = EnterVolume*math.pow(Martingale,y), limit = SteplimitLong)
    CancelPurchasesLong => strategy.cancel("PurchasesLong")
switch
    TPLong => strategy.exit("TPLong", qty_percent = 100, limit = limitLong)

///////// Conditions for a Short
bool EntryShort = ta.crossunder(macdSignalF, macdSignalS) and Sell and strategy.opentrades==0 and strategy.position_size==0
bool PurchasesShort = Sell and strategy.opentrades==x and strategy.position_size<0 and x<=VolumePurchases
bool CancelPurchasesShort = strategy.position_size==0 and strategy.opentrades==0
bool TPShort = strategy.position_size<0 and strategy.opentrades!=0

///////// Entry Short + add.purchases + cancel purchases + Take profit Short
switch
    EntryShort => strategy.entry("Entry Short", strategy.short, qty = EnterVolume)
    PurchasesShort => strategy.entry("PurchasesShort", strategy.short, qty = EnterVolume*math.pow(Martingale,y), limit = SteplimitShort)
    CancelPurchasesShort => strategy.cancel("PurchasesShort")
switch
    TPShort => strategy.exit("TPShort", qty_percent = 100, limit = limitShort)

/////////Calculation of conditions and reference data for level drawing
InTradeLong = strategy.position_size<0
InTradeShort = strategy.position_size>0
PickInLong = strategy.opentrades.entry_price(0)*(1-StepAddPurchases*y/100)
PickInShort = strategy.opentrades.entry_price(0)*(1+StepAddPurchases*y/100)

/////////Displaying the level of Take Profit
plot(InTradeLong ? na : limitLong, color=color.new(#00d146, 0), style=plot.style_linebr, linewidth=1)
plot(InTradeShort ? na : limitShort, color=color.new(#00d146, 0), style=plot.style_linebr, linewidth=1)

/////////Displaying the level of add.purchases
plot(InTradeLong ? na : PickInLong, color=color.white, style=plot.style_linebr, linewidth=1)
plot(InTradeShort ? na : PickInShort, color=color.white, style=plot.style_linebr, linewidth=1)