クロス移動平均マルチ指標取引戦略
概要
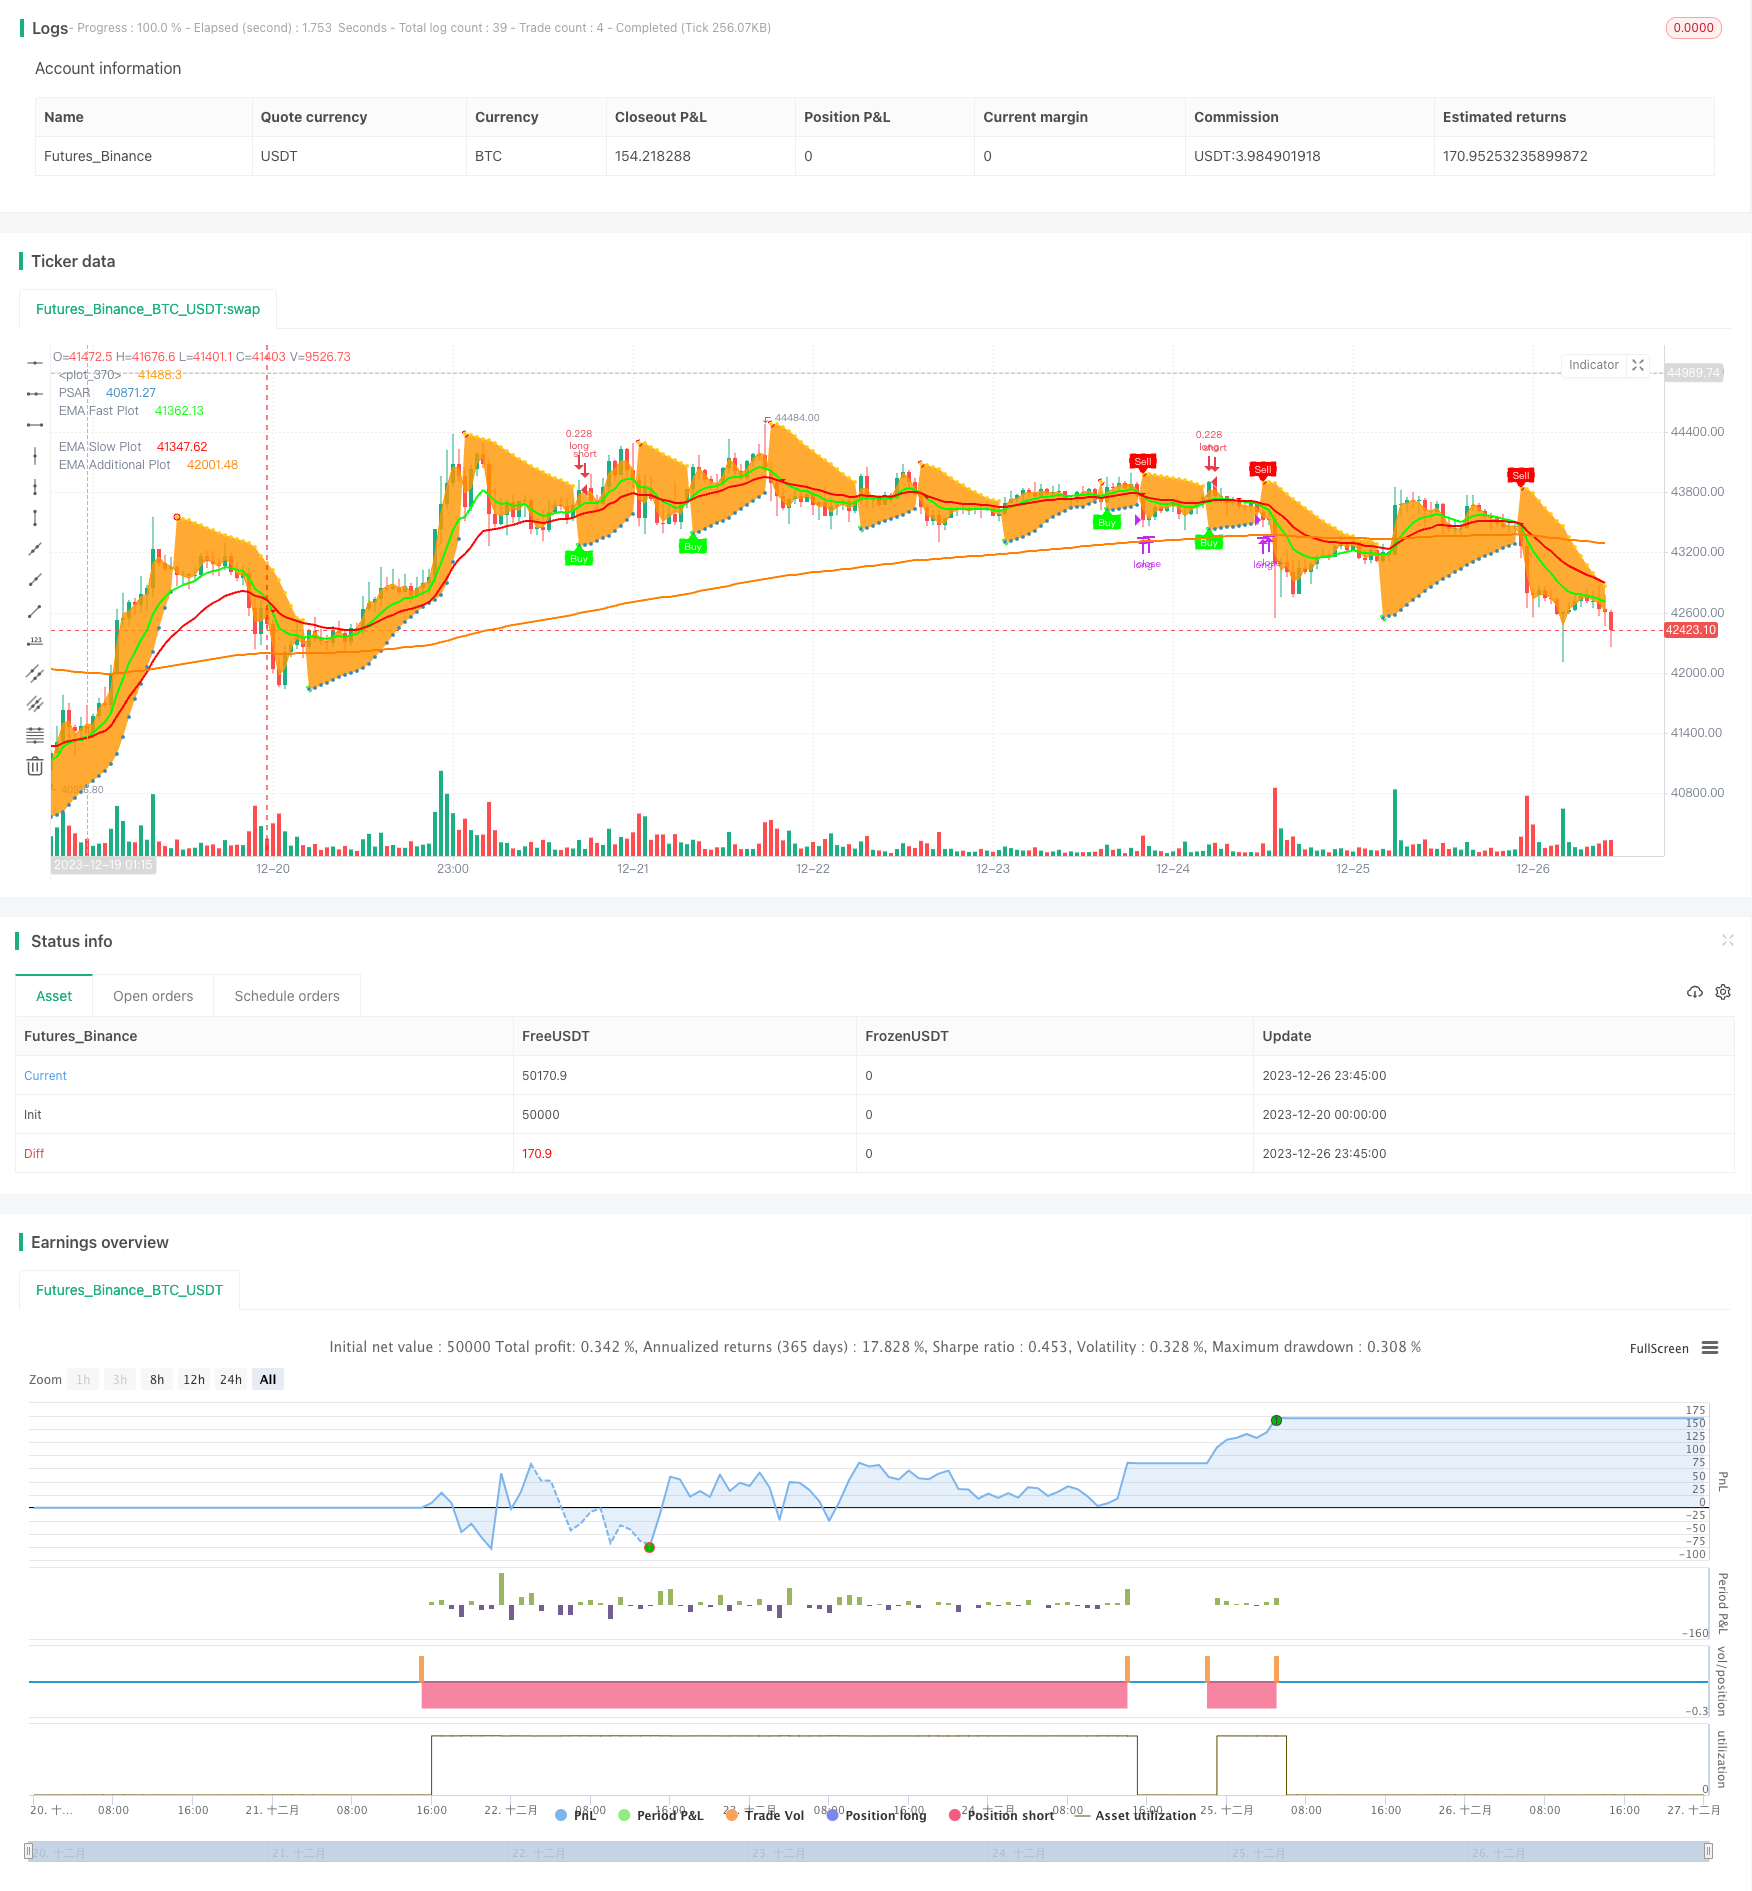
この戦略は,パラポリックSAR,トリプル指数移動平均 (TEMA),普通指数移動平均 (EMA),相対強弱指標 (RSI),均衡指標 (OBV) などを含む複数の技術指標を組み合わせて,株価の逆転信号を識別し,トレンドフィルターとストップ・ロスの設定と組み合わせて,買入と売却の信号を生成します.
戦略原則
この戦略は,パラポリックSARを価格逆転シグナルの主な指標として使用する.SARは,価格の上方には多頭状態,価格の下方には空頭状態を示す.SARは,価格の下方から上方への突破時に売り込みシグナルを生じ,価格の上方から下方への突破時に買い込みシグナルを生成する.
偽信号をフィルターするために,この戦略は,TEMAまたはEMAの技術指標を確認信号として使用する.SAR信号とTEMA (速線でゆっくりと走る) またはEMA (速線でゆっくりと走る) が同時に現れる場合にのみ,買い信号が生成される.SAR信号とTEMA (速線でゆっくりと走る) またはEMA (速線でゆっくりと走る) が同時に現れる場合にのみ,売り信号が生成される.
この戦略は,選択の確認信号としてRSI指標とOBV指標も提供しています.
さらに,この戦略は,価格の傾向をより明確に観察するために,三重のEMA技術指標のグラフ表示を提供し,トレンドの転換点を判断するのに役立つ模様指標eMAMAの表示を提供します.
この戦略は,複数の指標の最新状況をすばやく確認するために,グラフの下にある指標のまとめ表も提供しています.
優位分析
この戦略は,SAR,EMA/TEMA,RSI,OBVなどの複数の指標を組み合わせて,価格反転シグナルを効果的に発見し,偽の突破を避けることができます. 三重のEMAと模様平均のeMaMaのトレンド判断を添加することで,精度が向上します.
グラフは指標を豊富に表示し,市場状況を全面的に見ることができます.追加された指標総括表は,複数の指標の最新状態をすばやく取得できます.
取引ロジックのルールは明確で,パラメータは調整可能で,異なる取引品種に適応できます.
リスク分析
この戦略は指標変換による信号を発信し,指標が正しく設定されていない場合,大量のノイズ取引信号が生じます.指標パラメータは,異なる取引品種に応じて最適化される設定が必要です.
横横整理された市場では,SAR指標は頻繁に偽信号を生じることがあります.このとき,トレンド判断指標の確認に注意する必要があります.
交易品種の不適切な選択は,戦略の失敗にもつながる. 戦略を適用するには,明らかな傾向を持つ品種を選択する必要があります.
最適化の方向
この戦略は以下の方向から最適化できます.
- SARパラメータを最適化し,ノイズ信号を低減する
- 移動平均のパラメータを最適化し,トレンド判断の正確性を向上させる
- RSI,OBVなどの指標の効果をテストする
- 追加指標,多時間枠分析
- ストップ・ロスを最適化し,単一損失を制限する.
要約する
このクロス均線多指標取引戦略は,多種の一般的な技術分析指標を統合し,買賣決定信号を形成し,価格逆転点を効果的に識別することができ,パラメータが調整し,最適化しやすい特性を有し,経験豊富な量化トレーダーの適用に適しています.しかし,異なる品種特性の条件に応じてパラメータを最適化し,傾向が明らかな取引品種を選択する必要があります.
/*backtest
start: 2023-12-20 00:00:00
end: 2023-12-27 00:00:00
period: 45m
basePeriod: 5m
exchanges: [{"eid":"Futures_Binance","currency":"BTC_USDT"}]
*/

//
// ██╗      █████╗ ███████╗ ██████╗██╗██╗   ██╗██╗ ██████╗ ██╗   ██╗███████╗    ███╗   ███╗ ██████╗ ███╗   ██╗██╗  ██╗
// ██║     ██╔══██╗██╔════╝██╔════╝██║██║   ██║██║██╔═══██╗██║   ██║██╔════╝    ████╗ ████║██╔═══██╗████╗  ██║██║ ██╔╝
// ██║     ███████║███████╗██║     ██║██║   ██║██║██║   ██║██║   ██║███████╗    ██╔████╔██║██║   ██║██╔██╗ ██║█████╔╝
// ██║     ██╔══██║╚════██║██║     ██║╚██╗ ██╔╝██║██║   ██║██║   ██║╚════██║    ██║╚██╔╝██║██║   ██║██║╚██╗██║██╔═██╗
// ███████╗██║  ██║███████║╚██████╗██║ ╚████╔╝ ██║╚██████╔╝╚██████╔╝███████║    ██║ ╚═╝ ██║╚██████╔╝██║ ╚████║██║  ██╗
// ╚══════╝╚═╝  ╚═╝╚══════╝ ╚═════╝╚═╝  ╚═══╝  ╚═╝ ╚═════╝  ╚═════╝ ╚══════╝    ╚═╝     ╚═╝ ╚═════╝ ╚═╝  ╚═══╝╚═╝  ╚═╝
//																		 https://www.tradingview.com/u/LasciviousMonk/
//                                                                                                    © LasciviousMonk
//
//
//  This source code is subject to the terms of the Mozilla Public License 2.0 at https://mozilla.org/MPL/2.0/
//  This script provided freely.  No guarantee of functionality is provided.  You are welcome to use, revise, or modify
//  this code in any way you wish.  However, I kindly request that you publish any scripts originating from this code as
//  'Public'.  Please do not use this code as a basis for "Protected" or "Invite Only" scripts.
//
//
// PSAR + EMA + TEMA combines Parabolic PSAR plus EMA and TEMA trendlines.
//      - EMA and TEMA crossovers have an up or down triangle to indicate direction of cross.  Please note
//          that because these are Moving Averages (MAs), the triangle may not exactly line up with the crossover.
//      - Added MESA Adaptive Moving Average (eMAMA).  Crossovers of the fast and slow eMAMA may be used instead of
// 			EMA or TEMA.
//		- Added third EMA line.  May be used to filter entries.  For example, set the additional EMA to 200.  Buy signals
//			wil only be sent if the price is greater than the additional EMA.
//		- Added RSI and OBV as alternative PSAR confirmations.
//
// "Traffic Light" table: summarizes PSAR, RSI, SRSI, TEMA, EMA, eMAMA, MACD, OBV, and CMF indicators in a table.
//  This is intended as a quick "heads up", not to replace the indicators themselves.
//      - Arrows indicate direction of change since the last bar.
//      - Moving average indicators are indicated as green if the fast MA > slow MA and fast [T]EMA is increasing, red otherwise.
//          [T]EMA will be yellow if fast MA has increased over the last 2 periods but fast MA < slow MA.
//      - PSAR is as green if the PSAR is increasing, red if it is decreasing.
//      - RSI is indicated as green if RSI < oversold, red if RSI > overbought, yellow otherwise.
//      - SRSI is indicated as green K < oversold, and red if K > overbought.  If oversold < K < overbought,
//          green if K > D and red if K < D.
//      - MACD, OBV and CMF are green if bullish, red if bearish.
//
//
//  Suggestions for use:
//      - Use fast EMA crossing above slow EMA as a confirmation for PSAR signals.
//      - TEMA or eMAMA can also be used for confirmation signals insead.
//      - Instead of using a moving average (EMA, TEMA, etc) for confirmation, you may use RSI or OBV.
//      - The "traffic light" table is intended as a "heads up" to call your attention to other indicators
//          you may want to check.  I suggest Cipher B/VMC Cipher_B, Neglected Volume, and/or CM_Ult_MacD_MTF
//          as useful comparions.
//
// Please don't rely solely on the table.  It is intended to alert you to look more closely at a plot, not to
//    provide all the information you need to enter or exit a position.  I find the table to be a nice companion
//    to VMC Cipher_B, which can be overwhelming in its complexity.
//
// Code used:
//      - TEMA With Alert by BerkSay
//      - Parabolic SAR by Alex Orekhov (everget)
//      - Ehlers MESA Adaptive Moving Average [LazyBear]
//      - EMA, RSI and SRSI built-ins.
//@version=4
strategy(overlay=true, title="PSAR + EMA/TEMA/RSI/OBV", currency = 'USD', shorttitle="PSAR+",
 pyramiding = 0, default_qty_type=strategy.percent_of_equity, default_qty_value=20,
 initial_capital=5000, calc_on_every_tick=true, calc_on_order_fills=false,
 commission_type=strategy.commission.percent, commission_value=0.1)

// ------------------------------------------------<[ Color Constants ]>----------------------------------------------

// Color values used from Pine Magic.  https://www.tradingview.com/script/yyDYIrRQ-Pine-Color-Magic-and-Chart-Theme-Simulator/
var transparent = color.new(color.black, 100)
var darkpurple  = #550055, dpurple = darkpurple // Alias for dark purple,  Not recommended for use on "Dark Charts"
var purple      = #990099
var fuchsia     = #FF00FF
var violet      = #AA00FF
var hanpurple   = #6000FF
var blue        = #0000FF
var cichlid     = #0040FF
var azure       = #0080FF
var skyblue     = #00C0FF
var aqua        = #00FFFF // Not recommended for use on "Light Charts" with 1px line thickness
var mint        = #00FF80
var lime        = #00FF00
var chartreuse  = #80FF00
var yellow      = #FFFF00 // Not recommended for use on "Light Charts"
var amber       = #FFCC00
var orange      = #FF8000
var redorange   = #FF4000
var red         = #FF0000
var hotpink     = #FF0080
var pink        = #FF80FF // Not recommended for use on "Light Charts"

// ------------------------------------------------<[ User Input ]>---------------------------------------------------
sourceGlobal = input(title="Source for indicator", defval=close, type=input.source, group="Global")
tradeLong = input(title="Create long positions?", defval=true, type=input.bool, group="Global")
tradeShort = input(title="Create short positions?", defval=false, type=input.bool, group="Global")


showPSAR = input(true, "Show PSAR?", group="PSAR")
psarStart = input(title="PSAR Start", type=input.float, step=0.001, defval=0.02, group="PSAR")
psarIncrement = input(title="PSAR Increment", type=input.float, step=0.001, defval=0.02, group="PSAR")
psarMaximum = input(title="PSAR Maximum", type=input.float, step=0.01, defval=0.2, group="PSAR")
psarConfirmation = input(title="Confirmation signal:", defval="EMA",
     options=["EMA", "TEMA", "eMAMA", "RSI", "OBV"], group="PSAR")
psarHighlightStartPoints = input(title="PSAR Highlight Start Points?", type=input.bool, defval=true, group="PSAR")
psarShowLabels = input(title="PSAR Show Buy/Sell Labels?", type=input.bool, defval=true, group="PSAR")
psarHighlightState = input(title="PSAR Highlight State?", type=input.bool, defval=false, group="PSAR")
colorPSARLong = input(title="Long", type=input.color, defval=lime, group="PSAR", inline="colors")
colorPSARShort = input(title="Short", type=input.color, defval=red, group="PSAR", inline="colors")
useSL = input(defval=false, type=input.bool, title="Set stop loss to PSAR plot?")

showTEMA = input(false, "Show TEMA?", group="Triple EMA", inline="showTEMA")
showTEMAfill = input(title="Shade TEMA?", defval=false, type=input.bool, group="Triple EMA", inline="showTEMA")
lengthTEMAFast = input(title="TEMA Fast length", defval=13, minval=1, group="Triple EMA", inline="TemaFast")
colorTEMAFast = input(title="",type=input.color, defval=lime, inline="TemaFast", group="Triple EMA")
lengthTEMASlow = input(title="TEMA Slow length", defval=34, minval=1, group="Triple EMA", inline="TemaSlow")
colorTEMASlow = input(title="",type=input.color, defval=red, group="Triple EMA", inline="TemaSlow")
thicknessTEMA=input(title="Line thickness", defval=2, type=input.integer, minval=1, maxval=4, step=1, group="Triple EMA")

showEMA = input(defval=true, type=input.bool, title="Show EMA?", group="EMA", inline="showEMA")
showEMAfill = input(title="Shade EMA?", defval=false, type=input.bool, group="EMA", inline="showEMA")
lengthEMAFast = input(9, title='EMA Fast Length', step=1, type=input.integer, group="EMA", inline="EmaFast")
colorEMAFast = input(title="",type=input.color, defval=lime, inline="EmaFast", group="EMA")
lengthEMASlow = input(21, title='EMA Slow Length', step=1, type=input.integer, group="EMA", inline="EmaSlow")
colorEMASlow = input(title="",type=input.color, defval=red, group="EMA", inline="EmaSlow")
lengthEMA200 = input(200, title='EMA Additional Length', step=1, type=input.integer, group="EMA", inline="EMA200")
colorEMA200 = input(title="",type=input.color, defval=orange, group="EMA", inline="EMA200")
filterEMA200 = input(title="Use as filter?", defval=false, type=input.bool, group="EMA", inline="EMA200", tooltip="Buy and sell signals are filtered on the additional EMA line, commonly set to 200.  This takes effect even if the PSAR confirmation is set to something other than EMA.")

thicknessEMA=input(title="Line thickness", defval=2, type=input.integer, minval=1, maxval=4, step=1, group="EMA")

lengthRSI = input(title="RSI Length", type=input.integer, defval=14, group="RSI")
rsiOverbought = input(title="Overbought Level", type=input.integer, defval=60, group="RSI", inline="levels")
rsiOversold = input(title="Oversold Level", type=input.integer, defval=40, group="RSI", inline="levels")

showeMAMA = input(defval=false, title="Show eMAMA?", type=input.bool, group="Ehler's MESA Adaptive Moving Average", inline="fill")
showEMAMAfill = input(title="Shade eMAMA?", defval=false, type=input.bool, group="Ehler's MESA Adaptive Moving Average", inline="fill")
fastlimitEMAMA=input(.5, title="Fast Limit", group="Ehler's MESA Adaptive Moving Average")
slowlimitEMAMA=input(.05, title="Slow Limit", group="Ehler's MESA Adaptive Moving Average")
thicknessEMAMA=input(title="Line thickness", defval=2, type=input.integer, minval=1, maxval=4, step=1, group="Ehler's MESA Adaptive Moving Average")

coloreMAMA = input(title="eMAMA",type=input.color, defval=lime, group="Ehler's MESA Adaptive Moving Average", inline="colors")
coloreFAMA = input(title="eFAMA",type=input.color, defval=red, group="Ehler's MESA Adaptive Moving Average", inline="colors")

lengthOBV = input(defval=20, title="OBV Length", type=input.integer, group="On Balance Volume")
emaOBV    = input(defval=9, title="EMA length", type=input.integer, group="On Balance Volume")

lengthStoch = input(14, "Stochastic Length", minval=1, group="SRSI")
smoothK = input(3, "SRSI K Smoothing", minval=1, group="SRSI")
smoothD = input(3, "SRSI D Smoothing", minval=1, group="SRSI")
srsiOverbought = input(defval=80, title="Overbought level", type=input.integer, group="SRSI", inline="levels")
srsiOversold = input(defval=20, title="Oversold level", type=input.integer, group="SRSI", inline="levels")

lengthMACDfast = input(title="Fast Length", type=input.integer, defval=12, group="MACD")
lengthMACDslow = input(title="Slow Length", type=input.integer, defval=26, group="MACD")
lengthMACDsignal = input(title="Signal Smoothing", type=input.integer, minval = 1, maxval = 50, defval = 9, group="MACD")

lengthCMF = input(20, minval=1, group="Chaiken Money Flow")

showTable = input(defval=false, title="Show summary table?", type=input.bool, group="Summary Table")
tablePosition = input(title="Summary Table Position", defval=position.bottom_left,
     options=[position.bottom_left,
     position.top_left, position.bottom_right, position.top_right], group="Summary Table")
tableTextSize = input(title="Table Text Size", defval=size.tiny,
     options=[size.auto, size.tiny, size.small, size.normal, size.large, size.huge], group="Summary Table")

useDateRange = input(defval=true, title="Limit backtesting by date", type=input.bool, group="Limit by date",
	 tooltip="Limit window for backtesting.  This allows you to compare different TFs over the same period.")
rangeType = input(defval="30 Days", title="Date range:", options=["Custom", "30 Days", "90 Days", "180 Days", "Year to Date"], group="Limit by date")


startDate = input(title="Start Date (DD/MM/YYYY)", type=input.time,
     defval=timestamp("1 Jan 2021 1:01 -0400"), group="Limit by date")
endDate =   input(title="End Date (DD/MM/YYYY)  ", type=input.time,
     defval=timestamp("31 Dec 2100 19:59 -0400"), group="Limit by date", tooltip="You likely want to leave this far in the future.")

startDate := rangeType == "Custom" ? startDate :
     rangeType == "30 Days" ? timenow - 2592000000 :
     rangeType == "90 Days" ? timenow - 7776000000 :
     rangeType == "180 Days" ? timenow - 15552000000 :
     rangeType == "Year to Date" ? timestamp(syminfo.timezone, year(timenow), 01, 01, 00, 01) : na

inDateRange = (time >= startDate) and (time < endDate)
inDateRange := true


// ------------------------------------------------<[  Variable Declarations ]>----------------------------------------------
var bool psarConfirmationBuy = na
var bool psarConfirmationSell = na
var float eMAMA = na
var float eFAMA = na

var float historicalHigh = 0 // for OBV scaling

// -------------------------------------------------------<[ Functions ]>----------------------------------------------------
fDirection(series, length) =>
    rising(series,length) ? "↑" : "↓"

fTEMA(sourceTEMA, length) =>
    Tema1 = ema(sourceTEMA, length)
    Tema2 = ema(Tema1, length)
    Tema3 = ema(Tema2, length)
    3 * Tema1 - 3 * Tema2 + Tema3

fMAMA(sourceEMAMA, slowlimitEMAMA, fastlimitEMAMA) =>
	var float p = na
	var float i2 = na
	var float q2 = na
	var float re = na
	var float im = na
	var float spp = na
	sp = (4*sourceEMAMA + 3*sourceEMAMA[1] + 2*sourceEMAMA[2] + sourceEMAMA[3]) / 10.0
	dt = (.0962*sp + .5769*nz(sp[2]) - .5769*nz(sp[4])- .0962*nz(sp[6]))*(.075*nz(p[1]) + .54)
	q1 = (.0962*dt + .5769*nz(dt[2]) - .5769*nz(dt[4])- .0962*nz(dt[6]))*(.075*nz(p[1]) + .54)
	i1 = nz(dt[3])
	jI = (.0962*i1 + .5769*nz(i1[2]) - .5769*nz(i1[4])- .0962*nz(i1[6]))*(.075*nz(p[1]) + .54)
	jq = (.0962*q1 + .5769*nz(q1[2]) - .5769*nz(q1[4])- .0962*nz(q1[6]))*(.075*nz(p[1]) + .54)
	i2_ = i1 - jq
	q2_ = q1 + jI
	i2 := .2*i2_ + .8*nz(i2[1])
	q2 := .2*q2_ + .8*nz(q2[1])
	re_ = i2*nz(i2[1]) + q2*nz(q2[1])
	im_ = i2*nz(q2[1]) - q2*nz(i2[1])
	re := .2*re_ + .8*nz(re[1])
	im := .2*im_ + .8*nz(im[1])
	p1 = iff(im!=0 and re!=0, 360/atan(im/re), nz(p[1]))
	p2 = iff(p1 > 1.5*nz(p1[1]), 1.5*nz(p1[1]), iff(p1 < 0.67*nz(p1[1]), 0.67*nz(p1[1]), p1))
	p3 = iff(p2<6, 6, iff (p2 > 50, 50, p2))
	p := .2*p3 + .8*nz(p3[1])
	spp := .33*p + .67*nz(spp[1])
	phaseEMAMA = atan(q1 / i1)
	dphase_ = nz(phaseEMAMA[1]) - phaseEMAMA
	dphase = iff(dphase_< 1, 1, dphase_)
	alpha_ = fastlimitEMAMA / dphase
	alpha = iff(alpha_ < slowlimitEMAMA, slowlimitEMAMA, iff(alpha_ > fastlimitEMAMA, fastlimitEMAMA, alpha_))


fOBV(src) =>
    changeOBV = change(src)
    cum(changeOBV > 0 ? volume : changeOBV < 0 ? -volume : 0*volume)

// -------------------------------------------<[ Variable Calculations ]>------------------------------------------
temaSlow = fTEMA(sourceGlobal, lengthTEMASlow)
temaFast = fTEMA(sourceGlobal, lengthTEMAFast)
shortTema = crossover(temaSlow, temaFast)
longTema = crossunder(temaSlow, temaFast)
fillTema = temaFast>temaSlow ? color.new(colorTEMAFast,80) : color.new(colorTEMASlow,80)

emaFast = ema(sourceGlobal, lengthEMAFast)
emaSlow = ema(sourceGlobal, lengthEMASlow)
ema200 = ema(sourceGlobal, lengthEMA200)
longEMA = crossover(emaFast, emaSlow)
shortEMA = crossunder(emaFast , emaSlow)
fillEMA = emaFast>emaSlow ? color.new(colorEMAFast,80) : color.new(colorEMASlow,80)

cumOBV = fOBV(sourceGlobal)
oscOBV = (cumOBV - ema(cumOBV,lengthOBV))
changeOBV = change(sourceGlobal)
shortOBV = ema(cumOBV, lengthOBV)


psar = sar(psarStart, psarIncrement, psarMaximum)
psarDir = psar < close ? 1 : -1
colorPSAR = psarDir == 1 ? color.new(#3388bb,0) : color.new(#fdcc02,0)
colorPSARFill = psarHighlightState ? (psarDir == 1 ? color.new(colorPSARLong,90) : color.new(colorPSARShort,90)) : na
psarChangeCond = psarDir != psarDir[1]

valueRSI = rsi(sourceGlobal, lengthRSI)


if psarConfirmation == "EMA"
    if emaFast > emaSlow
        psarConfirmationBuy := true
        psarConfirmationSell := false
    else if emaFast < emaSlow
        psarConfirmationSell := true
        psarConfirmationBuy := false
else if psarConfirmation == "TEMA"
    if temaFast > temaSlow
        psarConfirmationBuy := true
        psarConfirmationSell := false
    else if temaFast < temaSlow
        psarConfirmationSell := true
        psarConfirmationBuy := false
else if psarConfirmation == "eMAMA"
    if eMAMA > eFAMA
        psarConfirmationBuy := true
        psarConfirmationSell := false
    else if eMAMA < eFAMA
        psarConfirmationSell := true
        psarConfirmationBuy := false
else if psarConfirmation == "RSI"
	if valueRSI < 40
        psarConfirmationBuy := true
        psarConfirmationSell := false
    else if valueRSI > 60
        psarConfirmationSell := true
        psarConfirmationBuy := false
else if psarConfirmation == "OBV"
	if oscOBV > 0
        psarConfirmationBuy := true
        psarConfirmationSell := false
    else if oscOBV < 0
        psarConfirmationSell := true
        psarConfirmationBuy := false

psarBuySignal = psarDir == 1 and psarDir[1] == -1 and (filterEMA200 ? open > ema200 : true) and inDateRange
psarSellSignal = psarDir == -1 and psarDir[1] == 1 and (filterEMA200 ? open < ema200 : true) and inDateRange

eMAMA := fMAMA(sourceGlobal, slowlimitEMAMA, fastlimitEMAMA)*sourceGlobal + (1 - fMAMA(sourceGlobal, slowlimitEMAMA, fastlimitEMAMA))*nz(eMAMA[1])
eFAMA := .5*fMAMA(sourceGlobal, slowlimitEMAMA, fastlimitEMAMA)*eMAMA + (1 - .5*fMAMA(sourceGlobal, slowlimitEMAMA, fastlimitEMAMA))*nz(eFAMA[1])
longMAMA=crossover(eMAMA, eFAMA)
shortMAMA=crossunder(eMAMA,eFAMA)
fillEMAMA = eMAMA>eFAMA ? color.new(coloreMAMA, 80) : color.new(coloreFAMA, 80)

srsiK = sma(stoch(valueRSI, valueRSI, valueRSI, lengthStoch), smoothK)
srsiD = sma(srsiK, smoothD)

fastMACD = ema(sourceGlobal, lengthMACDfast)
slowMACD = ema(sourceGlobal, lengthMACDslow)
macd = fastMACD - slowMACD
signalMACD = ema(macd, lengthMACDsignal)

adCMF = close==high and close==low or high==low ? 0 : ((2*close-low-high)/(high-low))*volume
mfCMF = sum(adCMF, lengthCMF) / sum(volume, lengthCMF)


// ================================== //
// ----> Conditional Parameters <---- //
// ================================== //

// ================================== //
// -------> Risk Mitigation <-------- //
// ================================== //

// ================================== //
// --------> Logical Order <--------- //
// ================================== //


// -------------------------------------------<[ Graphical Display ]>------------------------------------------

// TEMA plots
plotTemaSlow = plot(showTEMA ? temaSlow: na, color=color.new(colorTEMASlow,20), title="TEMA Slow plot", linewidth=thicknessTEMA)
plotTemaFast = plot(showTEMA ? temaFast: na, color=color.new(colorTEMAFast,20), title="TEMA Fast plot", linewidth=thicknessTEMA)

plotshape(showTEMA and longTema ? temaFast: na, style=shape.triangleup, location=location.absolute,
     size=size.tiny, title="TEMA Cross Up", color=color.new(colorTEMAFast,10))
plotshape(showTEMA and shortTema ? temaSlow: na, style=shape.triangledown, location=location.absolute,
     size=size.tiny, title="TEMA Cross Down", color=color.new(colorTEMASlow,10))
fill(plotTemaFast, plotTemaSlow, color=showTEMAfill ? fillTema : transparent, title="TEMA fill")

// EMA plots
plotEmaFast = plot(showEMA ? emaFast: na, title='EMA Fast Plot', color=colorEMAFast, linewidth=thicknessEMA)
plotEmaSlow = plot(showEMA ? emaSlow: na, title='EMA Slow Plot', color=colorEMASlow, linewidth=thicknessEMA)
plotEMA200 = plot(showEMA ? ema200: na, title='EMA Additional Plot', color=colorEMA200, linewidth=thicknessEMA)

plotshape(showEMA and longEMA ? emaFast : na, style=shape.triangleup, location=location.absolute, size=size.tiny,
	 title="EMA Cross Up",color=colorEMAFast)
plotshape(showEMA and shortEMA ? emaFast : na, style=shape.triangledown, location=location.absolute, size=size.tiny,
	 title="EMA Cross Down",color=colorEMASlow)
fill(plotEmaFast, plotEmaSlow, color=showEMAfill ? fillEMA : transparent, title="EMA fill")

// PSAR plots
psarPlot = plot(showPSAR ? psar: na, title="PSAR", style=plot.style_circles, linewidth=1, color=colorPSAR)
plotshape(showPSAR and psarBuySignal and psarHighlightStartPoints ? psar : na, title="PSAR Long Start", location=location.absolute,
	 style=shape.circle, size=size.tiny, color=colorPSARLong)
plotshape(showPSAR and psarBuySignal and psarShowLabels and psarConfirmationBuy ? psar : na, title="PSAR Buy Label", text="Buy", location=location.absolute,
	 style=shape.labelup, size=size.tiny, color=colorPSARLong, textcolor=color.white)
plotshape(showPSAR and psarSellSignal and psarHighlightStartPoints ? psar : na, title="PSAR Short Start", location=location.absolute,
	 style=shape.circle, size=size.tiny, color=colorPSARShort)
plotshape(showPSAR and psarSellSignal and psarShowLabels and psarConfirmationSell ? psar : na, title="PSAR Sell Label", text="Sell", location=location.absolute,
	 style=shape.labeldown, size=size.tiny, color=colorPSARShort, textcolor=color.white)
psarMidPricePlot = plot(ohlc4, title="", display=display.none, editable=false)
fill(psarMidPricePlot, psarPlot, title="PSAR Trade State Filling", color=colorPSARFill)


ploteMAMA = plot(showeMAMA ? eMAMA : na, title="Ehler's MAMA", linewidth=thicknessEMAMA, style=plot.style_line, color=coloreMAMA)
ploteFAMA = plot(showeMAMA ? eFAMA : na, title="Ehler's FAMA", linewidth=thicknessEMAMA, style=plot.style_line, color=coloreFAMA)
plotshape(showeMAMA and longMAMA ? eFAMA: na, style=shape.triangleup, location=location.absolute, size=size.tiny, title="eMAMA Cross Up",
	 color=color.new(coloreMAMA,10))
plotshape(showeMAMA and shortMAMA ? eFAMA: na, style=shape.triangledown, location=location.absolute, size=size.tiny, title="eMAMA Cross Down",
	 color=color.new(coloreFAMA,10))
fill(ploteMAMA, ploteFAMA, color=showEMAMAfill ? fillEMAMA : transparent, title="eMAMA fill")


// ---------------------------------------------------<[ Strategy Execution ]>-------------------------------------------------

strategy.entry(id="long", long=strategy.long, comment="enL", when=psarBuySignal and psarConfirmationBuy and tradeLong)
if useSL
	strategy.exit(id="long", stop=psar, comment="SL")
strategy.close(id="long", comment="exL", when=psarSellSignal and psarConfirmationSell and tradeLong)

strategy.entry(id="short", long=strategy.short, comment="enS", when=psarSellSignal and psarConfirmationSell and tradeShort)
if useSL
	strategy.exit(id="short", stop=psar, comment="SL")
strategy.close(id="short", comment="exS", when=psarBuySignal and psarConfirmationBuy and tradeShort)


// -------------------------------------------------------<[ Tables ]>---------------------------------------------------------

//   Shows red for bearish signals, green for bullish signals.
var table summaryTable = table.new(tablePosition, 3, 3)

if (barstate.islast and showTable)
    table.cell(summaryTable, 0, 0, "PSAR",text_size=tableTextSize, bgcolor = psarDir == 1 ? color.green : color.red)

    rsiDirection = fDirection(valueRSI,1)
    table.cell(summaryTable, 0, 1, "RSI " + tostring(round(valueRSI,0)) + rsiDirection,text_size=tableTextSize,
    	 bgcolor = iff(valueRSI > rsiOverbought, color.red, iff(valueRSI < rsiOversold, color.green, color.yellow)))

    srsiDirection = fDirection(srsiK,1)
    table.cell(summaryTable, 0, 2, "K " + tostring(round(srsiK,0)) + srsiDirection, text_size=tableTextSize,
    	 bgcolor=iff(srsiK > srsiOverbought, color.red, iff(srsiK < srsiOversold, color.green, srsiK > srsiD ? color.green : color.red)))

    emaDirection = fDirection(emaFast,1)
    table.cell(summaryTable, 1, 0, "EMA" + emaDirection,text_size=tableTextSize,
    	 bgcolor = emaFast > emaSlow and emaFast > emaFast[1] ? color.green : color.red)
    // See if emaFast has increased over the last two periods.
    if rising(emaFast,2) and emaFast < emaSlow
        table.cell_set_bgcolor(summaryTable, 1, 0, color.yellow)

    directionTEMA = fDirection(temaFast,1)
    table.cell(summaryTable, 1, 1, "TEMA" + directionTEMA,text_size=tableTextSize,
    	 bgcolor = temaFast > temaSlow and temaFast > temaFast[1] ? color.green : color.red)
    // See if temaFast has increased over the last two periods.
    if rising(temaFast,2) and temaFast < temaSlow
        table.cell_set_bgcolor(summaryTable, 1, 1, color.yellow)

    directionMAMA = fDirection(eMAMA,1)
    table.cell(summaryTable, 1, 2, "eMAMA" + directionMAMA,text_size=tableTextSize,
    	 bgcolor = eMAMA > eFAMA and eMAMA > eFAMA[1] ? color.green : color.red)
    // See if temaFast has increased over the last two periods.
    if rising(eMAMA,2) and eMAMA < eFAMA
        table.cell_set_bgcolor(summaryTable, 1, 2, color.yellow)

    directionMACD = fDirection(macd,2)
    table.cell(summaryTable, 2, 0, "MACD " + directionMACD, text_size=tableTextSize, bgcolor= macd > signalMACD ? color.green : color.red)

    directionOBV = fDirection(shortOBV,2)
    table.cell(summaryTable, 2, 1, "OBV " + directionOBV, text_size=tableTextSize, bgcolor= shortOBV > 0 ? color.green : color.red)

    directionCMF = fDirection(mfCMF,2)
    table.cell(summaryTable, 2, 2, "CMF " + directionCMF + tostring(mfCMF, "#.##"), text_size=tableTextSize, bgcolor= mfCMF > 0 ? color.green : color.red)


// ---------------------------------------------------<[ Alerts ]>-------------------------------------------------
if psarBuySignal and psarConfirmationBuy
	alert("PSAR buy/long signal confirmed for {{ticker}} on {{interval}}.", alert.freq_once_per_bar)

if psarSellSignal and psarConfirmationSell
	alert("PSAR sell/short signal confirmed for {{ticker}} on {{interval}}.", alert.freq_once_per_bar)

if psarChangeCond
	alert("PSAR has changed direction for {{ticker}} on {{interval}}.", alert.freq_once_per_bar)