線形回帰切片点に基づく定量戦略
作成日:
2023-12-29 11:45:20
最終変更日:
2023-12-29 11:45:20
コピー:
0
クリック数:
653
1
フォロー
1750
フォロワー
概要
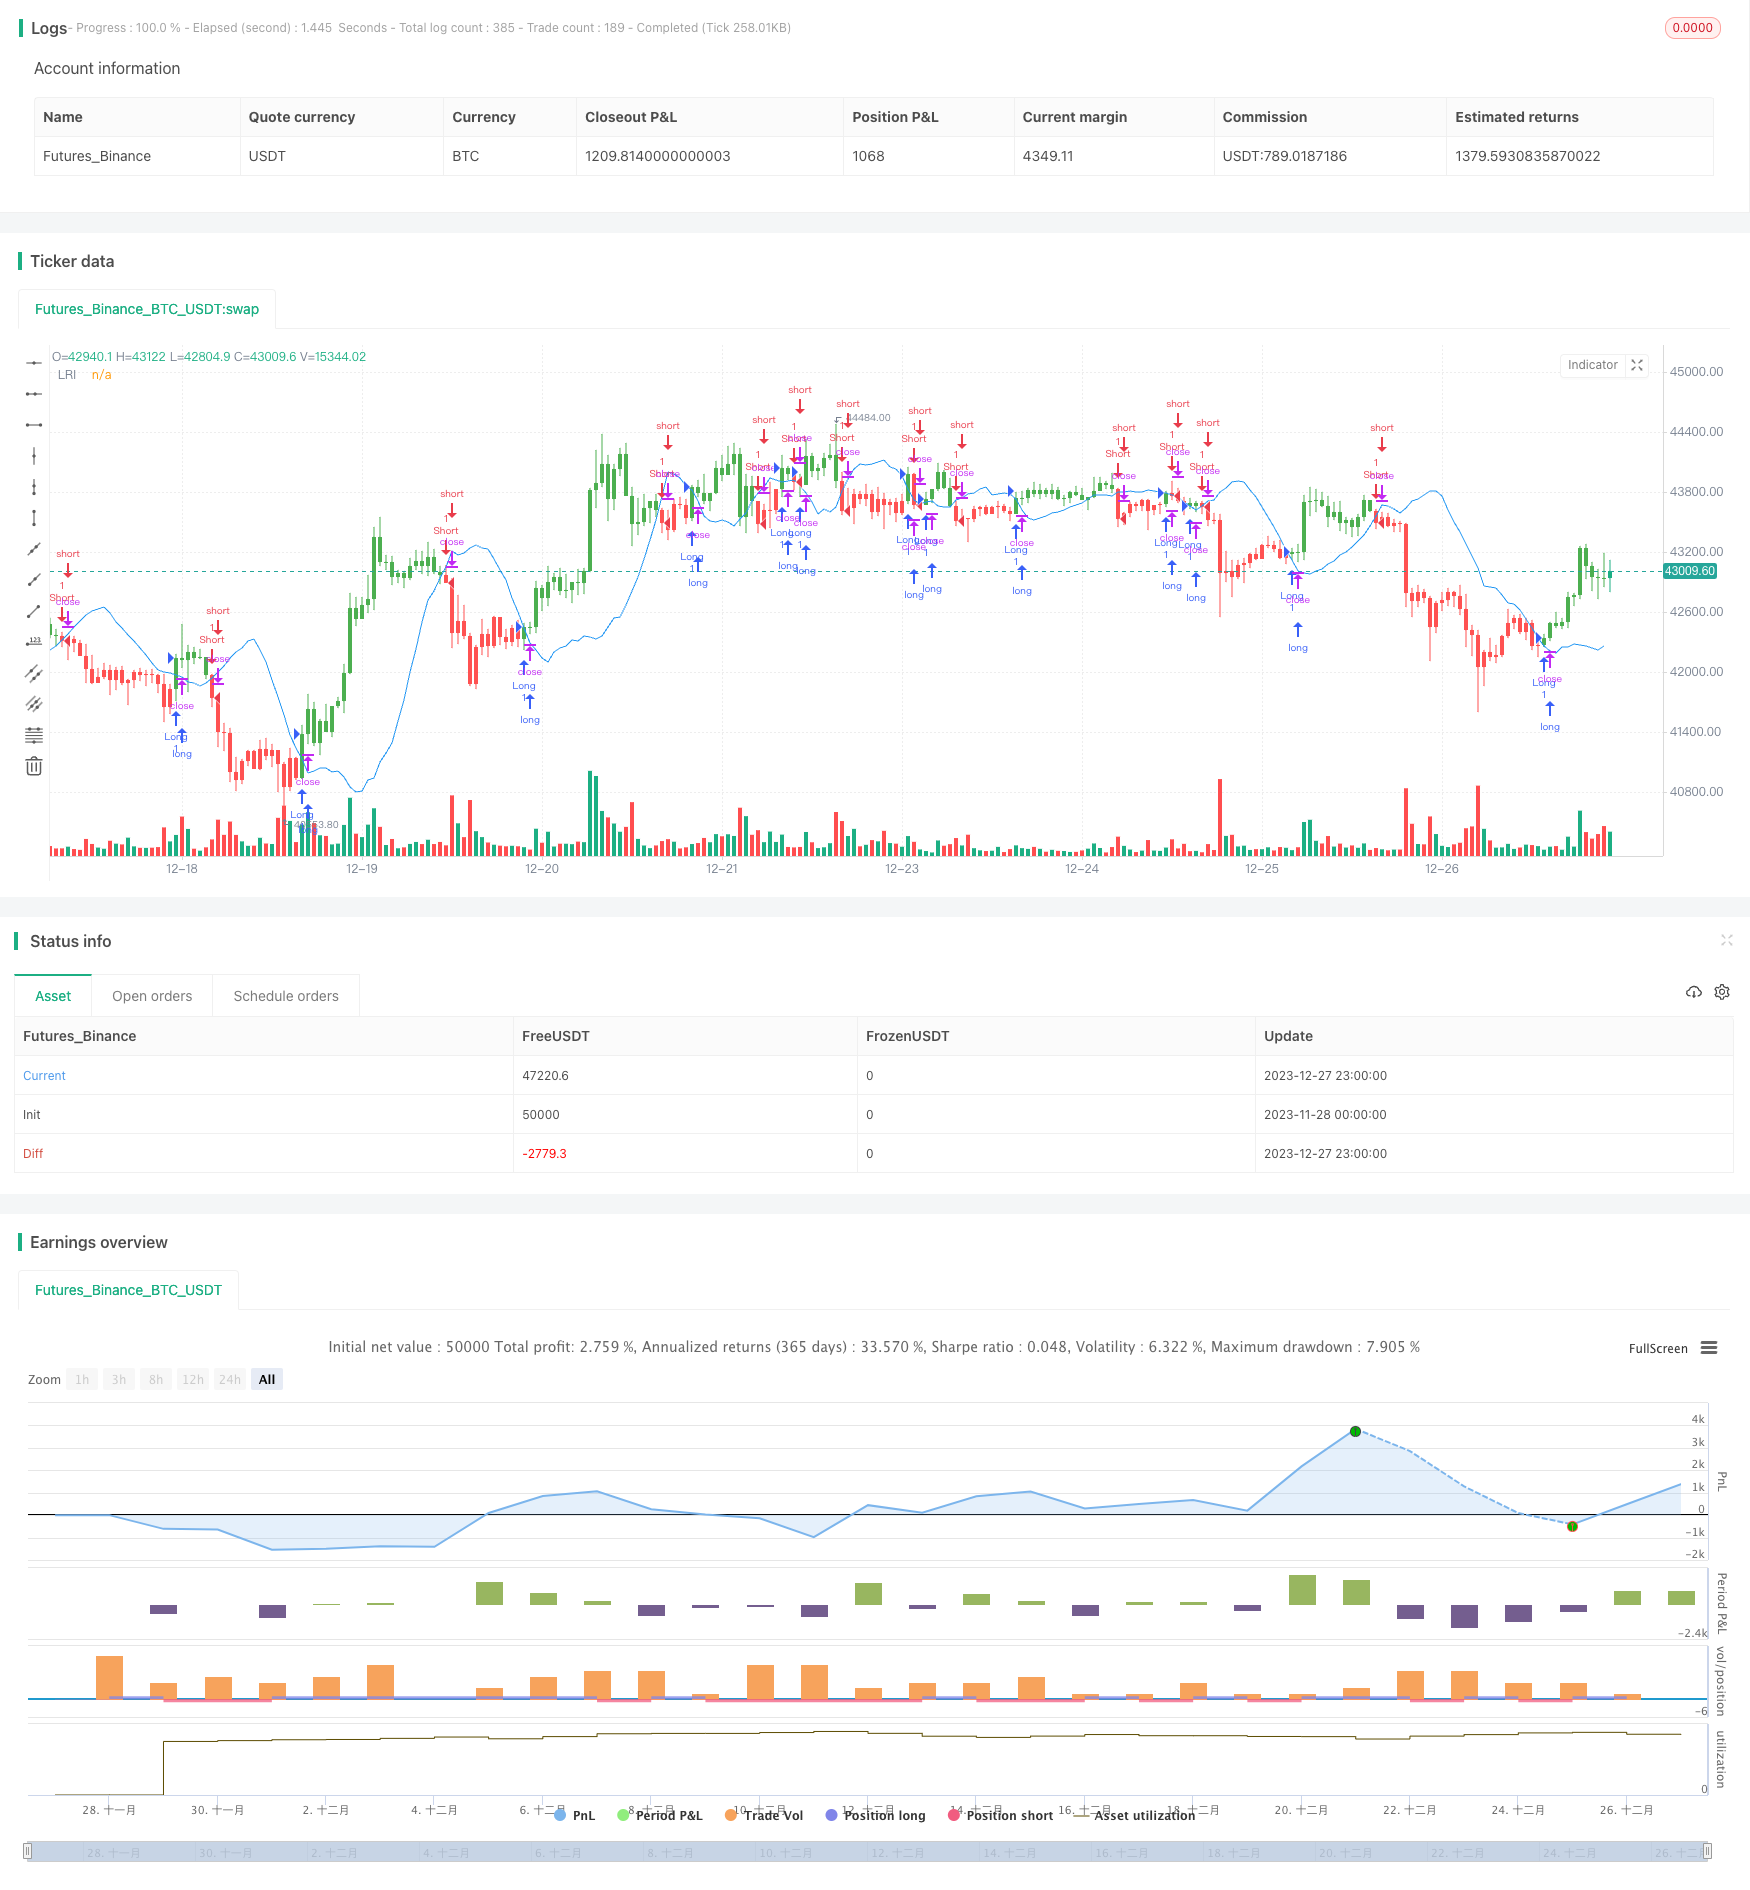
この戦略は,線形回帰の技術を使用して,線形回帰の停止点を計算し,それを買入シグナルとして使用して,定量取引戦略を構築する.この戦略は,株式価格の時間序列を分析して,線形回帰のトレンドラインを整え,線形回帰の停止点を使用して,価格が過大評価されているか過小評価されているかを判断して,シグナル取引を生成する.
戦略原則
線形回帰の停止点は,タイムシリーズXの値が0であるとき,Yの値 (通常は価格) の予測値を表します. この策略は,Lengthのパラメータを事前に設定し,閉盘価格をソースのシーケンスとして,Lengthの最新の日の線形回帰の停止点を計算します (xLRI). 閉盘価格がxLRIより高いとき,多めにします.
具体的計算式は次のとおりです.
xX = Length *(Length - 1)* 0.5
xDivisor = xX *xX - Length* Length *(Length - 1) *(2 * Length - 1) / 6
xXY = Σ(i *收盘价[i]),i从0到Length-1
xSlope = (Length *xXY - xX* Σ(收盘价, Length))/ xDivisor
xLRI = (Σ(收盘价, Length) - xSlope * xX) / Length
このような計算により,最近のLength日における線形回帰の阻止点xLRIが得られる.戦略は,価格の上昇と低下を判断して取引信号を生成する.
戦略的優位性
この戦略は以下の利点があります.
- 線形回帰技術を用いて,価格に対する予測能力とトレンド判断能力がある.
- パラメータが少なく,モデルがシンプルで,理解し,実装しやすい.
- カスタマイズ可能なパラメータLength adaptive 政策の柔軟性を調整する。
リスクと解決策
この戦略にはいくつかのリスクがあります.
- 線形帰帰帰マは,単に歴史的データに基づく統計的マッピングであり,将来の価格動向の予測能力は限られている.
- 会社の基本面が大きく変化した場合,線形回帰マッチングの結果は失効する可能性があります.
- 参数Lengthの設定を間違えた場合,過適合が発生する可能性があります.
対策として
- 参数Lengthを適正に短縮して,過適合を防止する.
- 会社の基本面の変化に注目し,必要に応じて人工介入でポジションを閉鎖する.
- 適応パラメータLengthを使用し,市場の状況に応じて動的に調整する.
戦略最適化の方向性
この戦略は,以下の点で最適化できます.
- 単一損失を抑えるための損失防止メカニズムの追加
- 他の指標と組み合わせて,統合戦略を策定し,安定性を高めます.
- Lengthのパラメータを動的に変えて,最適化モジュールに適応するパラメータを追加します.
- ポジション管理モジュールを追加し,過剰取引を防止します.
要約する
この戦略は,線形回帰の停止点に基づいて単純な量化取引戦略を構築している.全体的に,この戦略には一定の経済的価値がありますが,注意すべきいくつかのリスクもあります.継続的な最適化により,戦略の安定性と収益性をさらに向上させる見込みがあります.
ストラテジーソースコード
/*backtest
start: 2023-11-28 00:00:00
end: 2023-12-28 00:00:00
period: 1h
basePeriod: 15m
exchanges: [{"eid":"Futures_Binance","currency":"BTC_USDT"}]
*/

//@version=2
////////////////////////////////////////////////////////////
//  Copyright by HPotter v1.0 21/03/2018
// Linear Regression Intercept is one of the indicators calculated by using the
// Linear Regression technique. Linear regression indicates the value of the Y
// (generally the price) when the value of X (the time series) is 0. Linear
// Regression Intercept is used along with the Linear Regression Slope to create
// the Linear Regression Line. The Linear Regression Intercept along with the Slope
// creates the Regression line.
//
// You can change long to short in the Input Settings
// WARNING:
//  - For purpose educate only
//  - This script to change bars colors.
////////////////////////////////////////////////////////////
strategy(title="Line Regression Intercept Backtest", overlay = true)
Length = input(14, minval=1)
xSeria = input(title="Source", defval=close)
reverse = input(false, title="Trade reverse")
xX = Length * (Length - 1) * 0.5
xDivisor = xX * xX - Length * Length * (Length - 1) * (2 * Length - 1) / 6
xXY = 0
for i = 0 to Length-1
	xXY := xXY + (i * xSeria[i])
xSlope = (Length * xXY - xX * sum(xSeria, Length)) / xDivisor
xLRI = (sum(xSeria, Length) - xSlope * xX) / Length
pos = iff(close > xLRI, 1,
       iff(close < xLRI, -1, nz(pos[1], 0)))
possig = iff(reverse and pos == 1, -1,
          iff(reverse and pos == -1, 1, pos))
if (possig == 1)
    strategy.entry("Long", strategy.long)
if (possig == -1)
    strategy.entry("Short", strategy.short)
barcolor(possig == -1 ? red: possig == 1 ? green : blue )
plot(xLRI, color=blue, title="LRI")