モメンタム指標によるトリプル確認トレンドフォロー戦略
概要
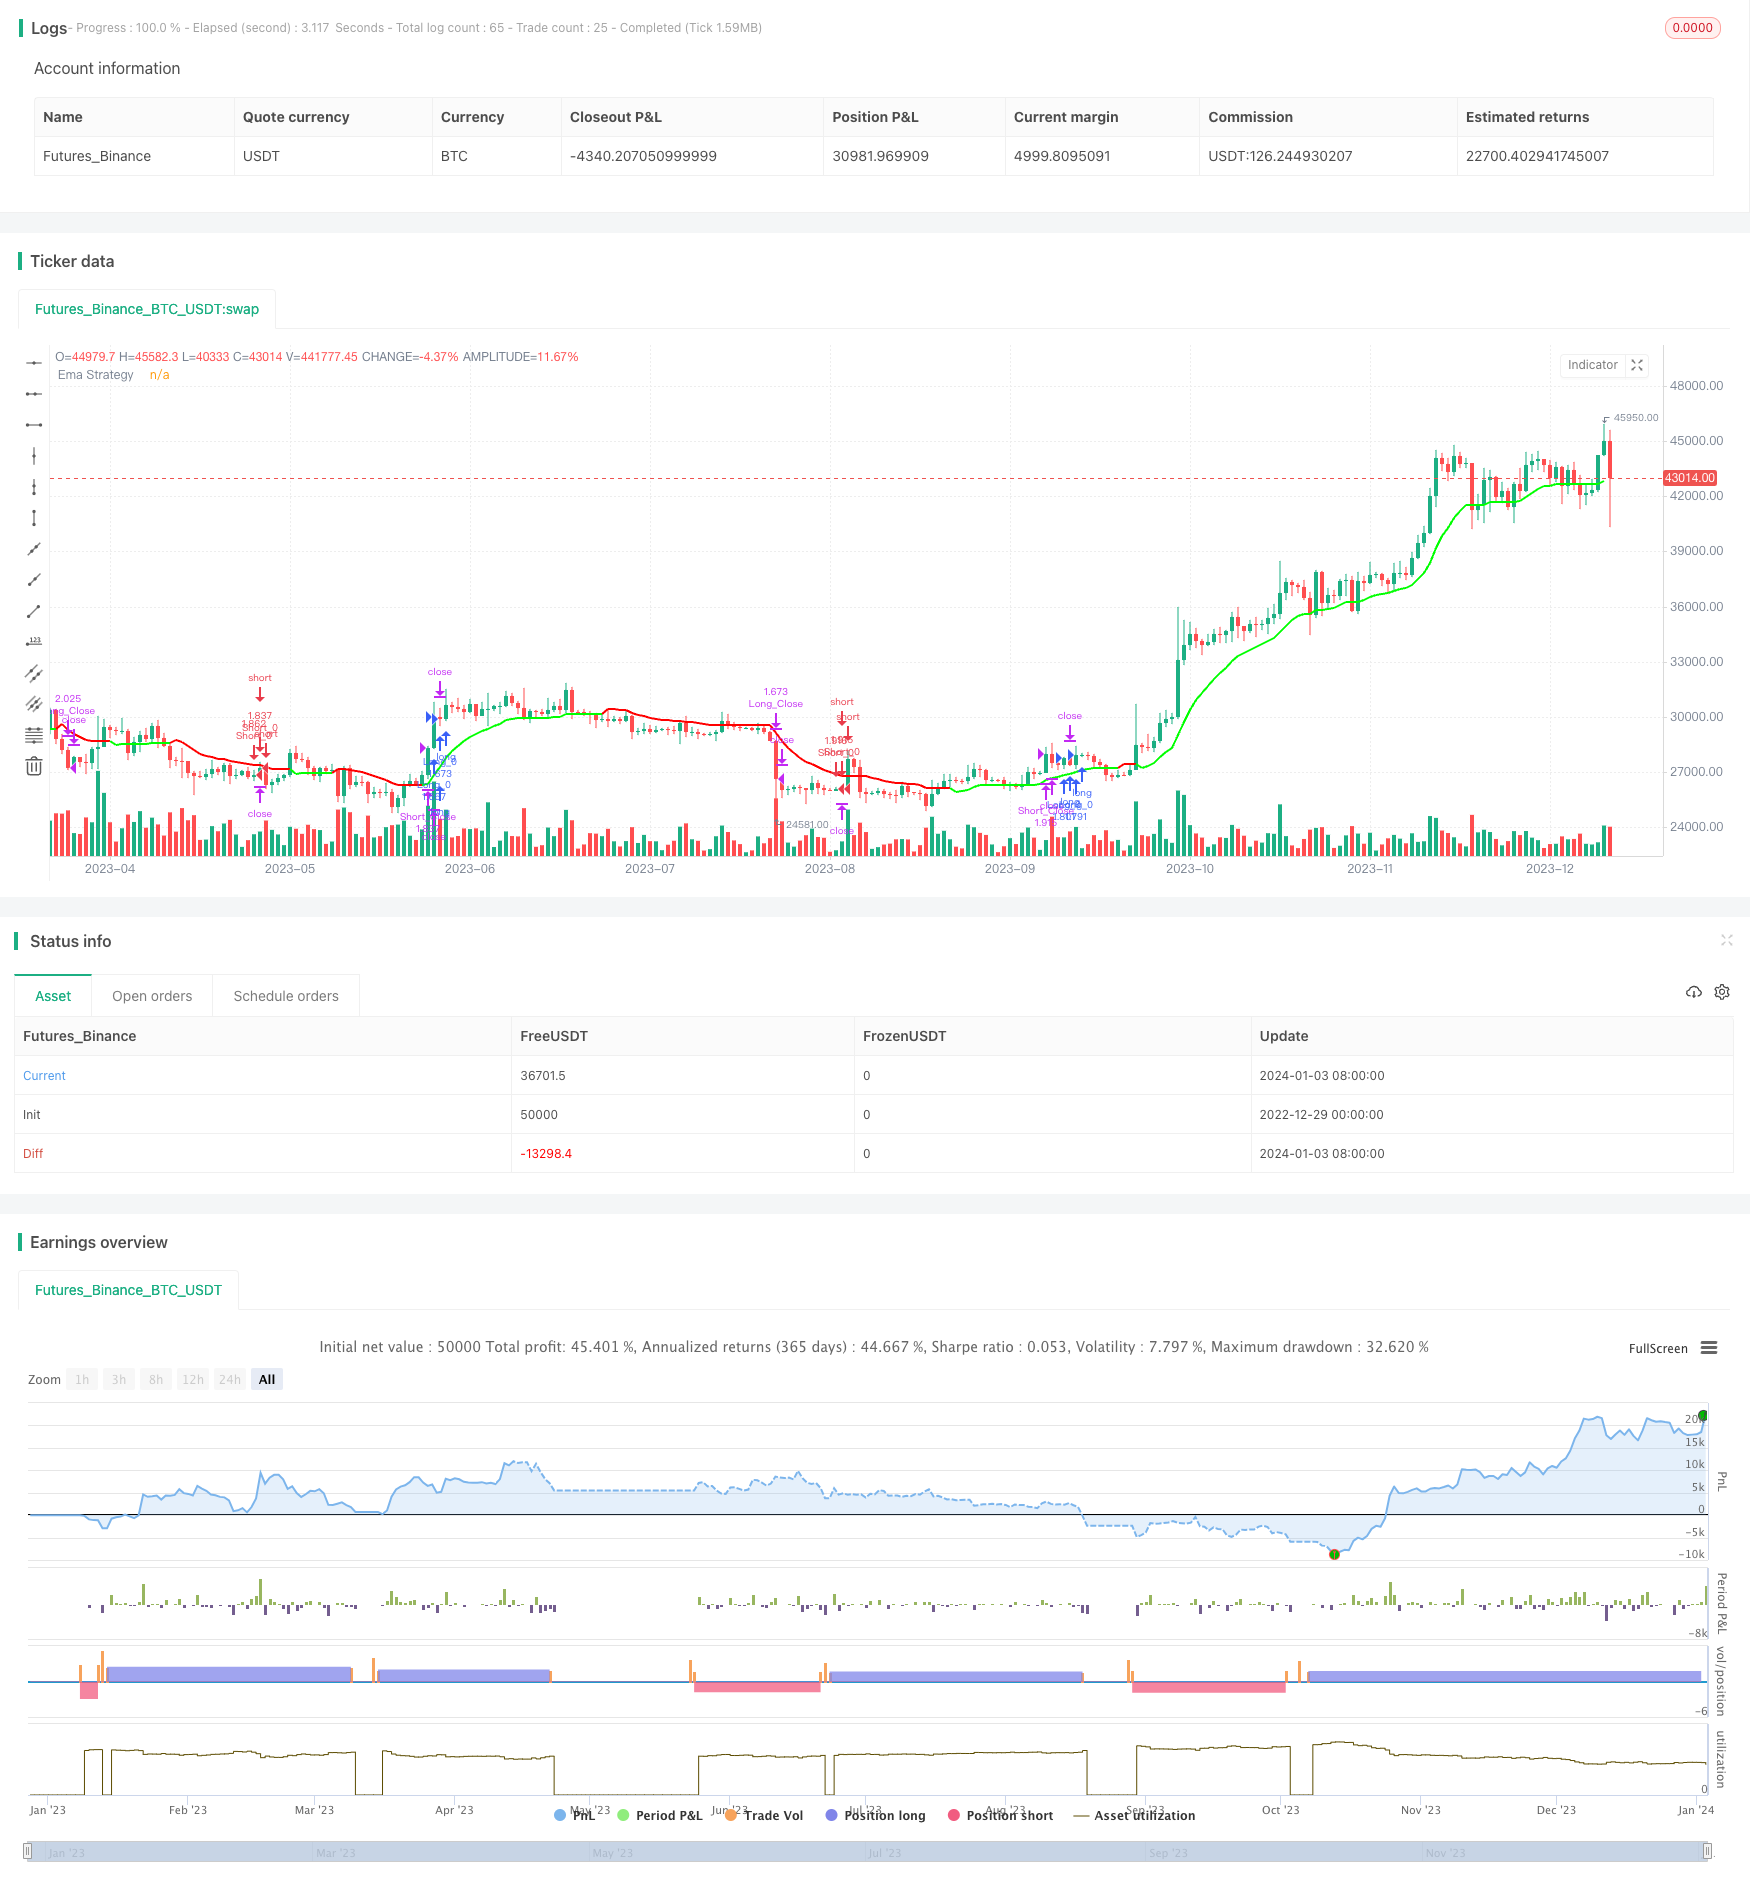
この戦略は,3つの確認メカニズムを使用して取引シグナルを生成します.つまり,市場傾向が強いことを確認する動向指標,傾向の方向を確認する超トレンド指標,および傾向の方向を確認する追加の検証としてEMA指標です. この3つの指標が条件を満たしている場合にのみ,戦略は多額の取引または空白の取引シグナルを生成します.
戦略原則
モメンタム RSI
動態RSIは,市場トレンドの強さを判断するために使用される. 60以上の読み方は,市場トレンドが強いことを示す.
取引のシグナルは,激しい牛市や熊市の中でのみ発生します.
スーパートレンド分析
超トレンドラインは,市場のトレンドの方向を表します. 価格が超トレンドラインを破るときのみ,ポジションを考慮してください.
価格が上から超トレンドラインを突破すると,多頭トレンドに変換される.価格が上から下へと突破すると,空頭トレンドに変換される.
EMAの戦略
- EMAとその補助トレンドラインは,トレンドの方向を確認するために使用される.買い信号は,EMAが補助トレンドラインを上方突破したときにのみ発生し,空頭信号は,その逆である.
この3つの指標が同時にポジション構築条件を満たす場合にのみ,真の取引信号が発信されます.これは,偽の信号の数を大幅に減らし,戦略の安定性を高めます.
優位分析
この戦略は,非常に高い安定性と収益性を持っています. 主要な利点は:
複数の確認メカニズム,効率的なノイズフィルタリング,高確率取引のみを選択.
超トレンドラインの動態追跡・ストップ・ローズ,リスクの有効な制御.
トレンドの強さを考慮して判断し,強気なトレンドのみで取引し,追加のリスクを避ける.
EMAの指標の追加検証により,取引の方向性が正しく確認されます.
完全にパラメータ化され,あらゆるタイプのトレーダーにカスタマイズできます.
リスク分析
この戦略の主なリスクは,異常突破によって引き起こされる誤った取引シグナルによるものです. 主なリスクと解決策は以下の通りです.
偽の侵入の危険性: 侵入の検証メカニズムを増やす
震源範囲の拡大リスク: 適切な止損範囲の調整
トレンド逆転リスク: ポジションの周期を短縮し,時効で損失を止める.
最適化の方向
この戦略は以下の方向から最適化できます.
最適化パラメータ:指標パラメータを調整して,より多くの品種に対応する。
フィルターを増やす: 信号の質を向上させるため,より多くの指標を組み合わせる.
複合戦略:他の戦略と組み合わせて,優位性を活用して互いを補完する.
動的調節:市場の状況に応じてパラメータを自動的に調整する.
機械学習:アルゴリズムを使って最適参数を探し出す.
要約する
この戦略は,動的指標,超トレンド,およびEMAを効果的に組み合わせることで,複数の確認された高確率の取引戦略を実現している.厳格なブレイク検証メカニズムも,非常に強い安定性を持っている.同時に,非常に高いカスタマイズ性と最適化の余地がある.全体的に,この戦略は,トレンド追跡と断裂型の取引の優位性を融合し,非常に有望なアルゴリズム取引戦略である.
/*backtest
start: 2022-12-29 00:00:00
end: 2024-01-04 00:00:00
period: 1d
basePeriod: 1h
exchanges: [{"eid":"Futures_Binance","currency":"BTC_USDT"}]
*/

//@version=5
strategy('The Flash-Strategy (Momentum-RSI, EMA-crossover, ATR)', shorttitle='The Flash-Strategy (Momentum-RSI, EMA-crossover, ATR)', overlay=true,initial_capital = 1000)
//// author -  Baby_whale_to_moon

// MOM Rsi indicator
group_mom_rsi = "Rsi Of Momentum "
len = input.int(10, minval=1, title="Length Mom-Rsi", group =group_mom_rsi ,tooltip = 'This ind calculate Rsi value of Momentum we use this ind to determine power of trend')
src2 = close
mom = src2 - src2[len]
rsi_mom = ta.rsi(mom, len)
mom_rsi_val = input.int(60, minval=1, title="Mom-Rsi Limit Val", group =group_mom_rsi, tooltip = "When our Mom-Rsi value more then this we open LONG or Short, with help of this indicator we we determine the status of the trend")

// Super Trend Ind
group_supertrend = "SuperTrend indicator"
atrPeriod = input(10, "ATR Length SuperTrend", group = group_supertrend)
factor = input.float(3.0, "Factor SuperTrend", step = 0.01, group = group_supertrend)

[supertrend, direction] = ta.supertrend(factor, atrPeriod)

// Ema Indicator
group_most = "Ema indicator"
src = input(close, 'Source Ema Ind',group = group_most)
AP2 = input.int(defval=12, title='Length Ema Ind', minval=1,group = group_most)
Trail1 = ta.ema(src, AP2) //Ema func
AF2 = input.float(defval=1, title='Percent Ema Ind', minval=0.1,group = group_most) / 100
SL2 = Trail1 * AF2  // Stoploss Ema
Trail2 = 0.0
iff_1 = Trail1 > nz(Trail2[1], 0) ? Trail1 - SL2 : Trail1 + SL2
iff_2 = Trail1 < nz(Trail2[1], 0) and Trail1[1] < nz(Trail2[1], 0) ? math.min(nz(Trail2[1], 0), Trail1 + SL2) : iff_1
Trail2 := Trail1 > nz(Trail2[1], 0) and Trail1[1] > nz(Trail2[1], 0) ? math.max(nz(Trail2[1], 0), Trail1 - SL2) : iff_2

//Bull = ta.barssince(Trail1 > Trail2 and close > Trail2 and low > Trail2) < ta.barssince(Trail2 > Trail1 and close < Trail2 and high < Trail2)

//TS1 = plot(Trail1, 'ExMov', style=plot.style_line, color=Trail1 > Trail2 ? color.rgb(33, 149, 243, 100) : color.rgb(255, 235, 59, 100), linewidth=2)
//TS2 = plot(Trail2, 'ema', style=plot.style_line, color=Trail1 > Trail2 ? color.rgb(76, 175, 79, 30) : color.rgb(255, 82, 82, 30), linewidth=2)
//fill(TS1, TS2, Bull  ? color.green : color.red, transp=90)


// Strategy Sett
group_strategy = "Settings of Strategy"
Start_Time = input(defval=timestamp('01 January 2000 13:30 +0000'), title='Start Time of BackTest', group =group_strategy)
End_Time = input(defval=timestamp('30 April 2030 19:30 +0000'), title='End Time of BackTest', group =group_strategy)
dollar = input.float(title='Dollar Cost Per Position* ', defval=50000, group =group_strategy)
trade_direction = input.string(title='Trade_direction', group =group_strategy, options=['LONG', 'SHORT', 'BOTH'], defval='BOTH')
v1 = input(true, title="Version 1 - Uses SL/TP Dynamically ", group =group_strategy ,tooltip = 'With this settings our stoploss price increase or decrease with price to get better PNL score')

v2 = input(false, title="Version 2 -  Uses SL/TP Statically", group =group_strategy)
v2stoploss_input = input.float(5, title='Static Stop.Loss % Val', minval=0.01, group =group_strategy)/100
v2takeprofit_input = input.float(10, title='Static Take.Prof % Val', minval=0.01, group =group_strategy)/100

v2stoploss_level_long = strategy.position_avg_price * (1 - v2stoploss_input)
v2takeprofit_level_long = strategy.position_avg_price * (1 + v2takeprofit_input)

v2stoploss_level_short = strategy.position_avg_price * (1 + v2stoploss_input)
v2takeprofit_level_short = strategy.position_avg_price * (1 - v2takeprofit_input)

group_line = "Line Settings"
show_sl_tp = input.bool(title='  Show StopLoss - TakeProf Lines',inline = "1", defval=true, group =group_line)
show_trend_line = input.bool(title='  Show Trend Line',inline = '3' ,defval=true, group =group_line)
stoploss_colour = input.color(title='StopLoss Line Colour',inline = '2' ,defval=color.rgb(255, 255, 0), group =group_line)
up_trend_line_colour = input.color(title='Up Trend line Colour',inline = '4' ,defval=color.rgb(0, 255, 0, 30), group =group_line)
down_trend_line_colour = input.color(title='Down Trend line Colour',inline = '4' ,defval=color.rgb(255, 0, 0, 30), group =group_line)

//plot(supertrend ,color = strategy.position_size > 0 and show_sl_tp ? color.rgb(255, 0, 0) :show_sl_tp ? color.rgb(0, 255, 0) : na , style = plot.style_steplinebr,linewidth = 2)
// plot(supertrend ,color = show_sl_tp and v1 ? stoploss_colour : na , style = plot.style_steplinebr,linewidth = 2)

// plot(v2stoploss_level_long ,color = strategy.position_size > 0 and show_sl_tp and v2 ? stoploss_colour : na , style = plot.style_steplinebr,linewidth = 2)
// plot(v2stoploss_level_short ,color = strategy.position_size < 0 and show_sl_tp and v2 ? stoploss_colour : na , style = plot.style_steplinebr,linewidth = 2)
// plot(v2takeprofit_level_long  ,color = strategy.position_size > 0 and show_sl_tp and v2 ? up_trend_line_colour : na , style = plot.style_steplinebr,linewidth = 2)
// plot(v2takeprofit_level_short ,color = strategy.position_size < 0 and show_sl_tp and v2 ? up_trend_line_colour : na , style = plot.style_steplinebr,linewidth = 2)


TS2 = plot(Trail2, 'Ema Strategy', style=plot.style_line, color=show_trend_line and Trail1 < Trail2 ? down_trend_line_colour : show_trend_line ? up_trend_line_colour  : na, linewidth=2)

// bgcolor(buy_signal ? color.rgb(0, 230, 119, 80) : na)
// bgcolor(sell_signal ? color.rgb(255, 82, 82, 80) : na)

Time_interval = true
buy_signal = Trail1 > Trail2 and direction < 0 and rsi_mom > mom_rsi_val and Time_interval
sell_signal =Trail1 < Trail2 and direction > 0 and rsi_mom > mom_rsi_val and Time_interval


// Strategy entries
if strategy.opentrades == 0 and buy_signal and ( trade_direction == 'LONG' or trade_direction == 'BOTH')
    strategy.entry('Long_0', strategy.long, qty=dollar / close)

if strategy.opentrades == 0 and sell_signal and ( trade_direction == 'SHORT' or trade_direction == 'BOTH')
    strategy.entry('Short_0', strategy.short, qty=dollar / close)


if close < supertrend and v1
    strategy.exit('Long_Close',from_entry = "Long_0", stop=supertrend, qty_percent=100)
if  v2 and strategy.position_size > 0
    strategy.exit('Long_Close',from_entry = "Long_0", stop=v2stoploss_level_long,limit= v2takeprofit_level_long  , qty_percent=100)

if close > supertrend and v1
    strategy.exit('Short_Close',from_entry = "Short_0", stop=supertrend, qty_percent=100)
if  v2 and strategy.position_size < 0
    strategy.exit('Short_Close',from_entry = "Short_0", stop=v2stoploss_level_short,limit= v2takeprofit_level_short ,qty_percent=100)