短期トレンドフォロー反転戦略
概要
トレンド追跡反転戦略は,15分NQ期貨に基づく短期トレンド取引戦略である.トレンドの波動と反転パターンの認識によって取引機会を探している.この戦略はシンプルで効果的で,ショートラインのアクティブトレーダーに適している.
戦略原則
この戦略は以下の原則に基づいています.
8周期のEMAを主要トレンドフィルタリング指標として使用し,EMAは上方見込み,EMAは下方見込みである.
特定のK線反転形状を入場信号として識別し,長陽線に続く短陰線看多信号と長陰線に続く短陽線看空信号を含む形状は,トレンドが反転し始めることを示唆する.
エントリーポイントは反転K線の高点または低点の近くで,ストップポイントは反転K線自体の高低点として設定され,高効率のリスク・リターン比率を実現する.
K線実体関係を使って反転信号の有効性を判断する.例えば,陰線開盤価格が上位のK線実体より高く,実体は完全に包含するなどルールを用いて騒音をフィルターする.
特定の取引時間のみで動作する戦略で,市場の主要契約の交換月などの特別な期間を避け,異常な状況から不必要な損失を防ぐ.
優位分析
この戦略には以下の利点があります.
戦略信号はシンプルで有効で 実行しやすい.
黄牛市場と熊市場の二重殺戮を避けるために,トレンドと逆転の判断に基づいています.
リスクがコントロールされ,ストップ・ロストが合理的に設定され,資金管理に有利である.
データの需要は小さく,様々なソフトウェアやプラットフォームで使用できます.
取引頻度が高く,短期的なアクティブ取引を熱望する投資家に適しています.
リスクと対策
この戦略にはいくつかのリスクがあり,主な問題は以下の通りです.
逆転形状の機会が不足し,信号が少ない。逆転判断の規則を適切に緩和することができる。
偽突破の問題が発生する際には,さらに多くのフィルタリング指標を追加して共同判断を行うことができます.
夜盤と非主流時間には不安定性がある.米国取引時間のみで動作するように設定することができる.
参数最適化のスペースは限られている. より優れた参数を見つけるために,機械学習などの技術を試すことができます.
最適化の方向
この戦略には改善の余地があり,主な方向は以下の通りです.
より長い周期のEMAパラメータをテストし,トレンド判断を改善する.
株価指数を追加してトレンドフィルタリング指数として追加する.
機械学習などの技術を活用して,自動でエントリー・ストップ・ポイントを最適化します.
波動性に基づくポジションとストップダメージの動的調整メカニズムを増加させる.
単一品種のシステム上のリスクをさらに分散させるため,複数の品種をアベリゲートしてみる.
要約する
トレンド追跡逆転戦略は,全体として非常に実用的なショートライン戦略の考え方であり,単純なパラメータが少なく,操作が簡単で,個人的リスクをよくコントロールでき,株価論壇のアクティブタイプのショートライントレーダーに適しています.この戦略には一定の最適化余地があり,ある程度の研究開発エネルギーを投入することで,中長期線資金に適したプログラム化操作を行うことができるので,良好な発展の可能性があります.
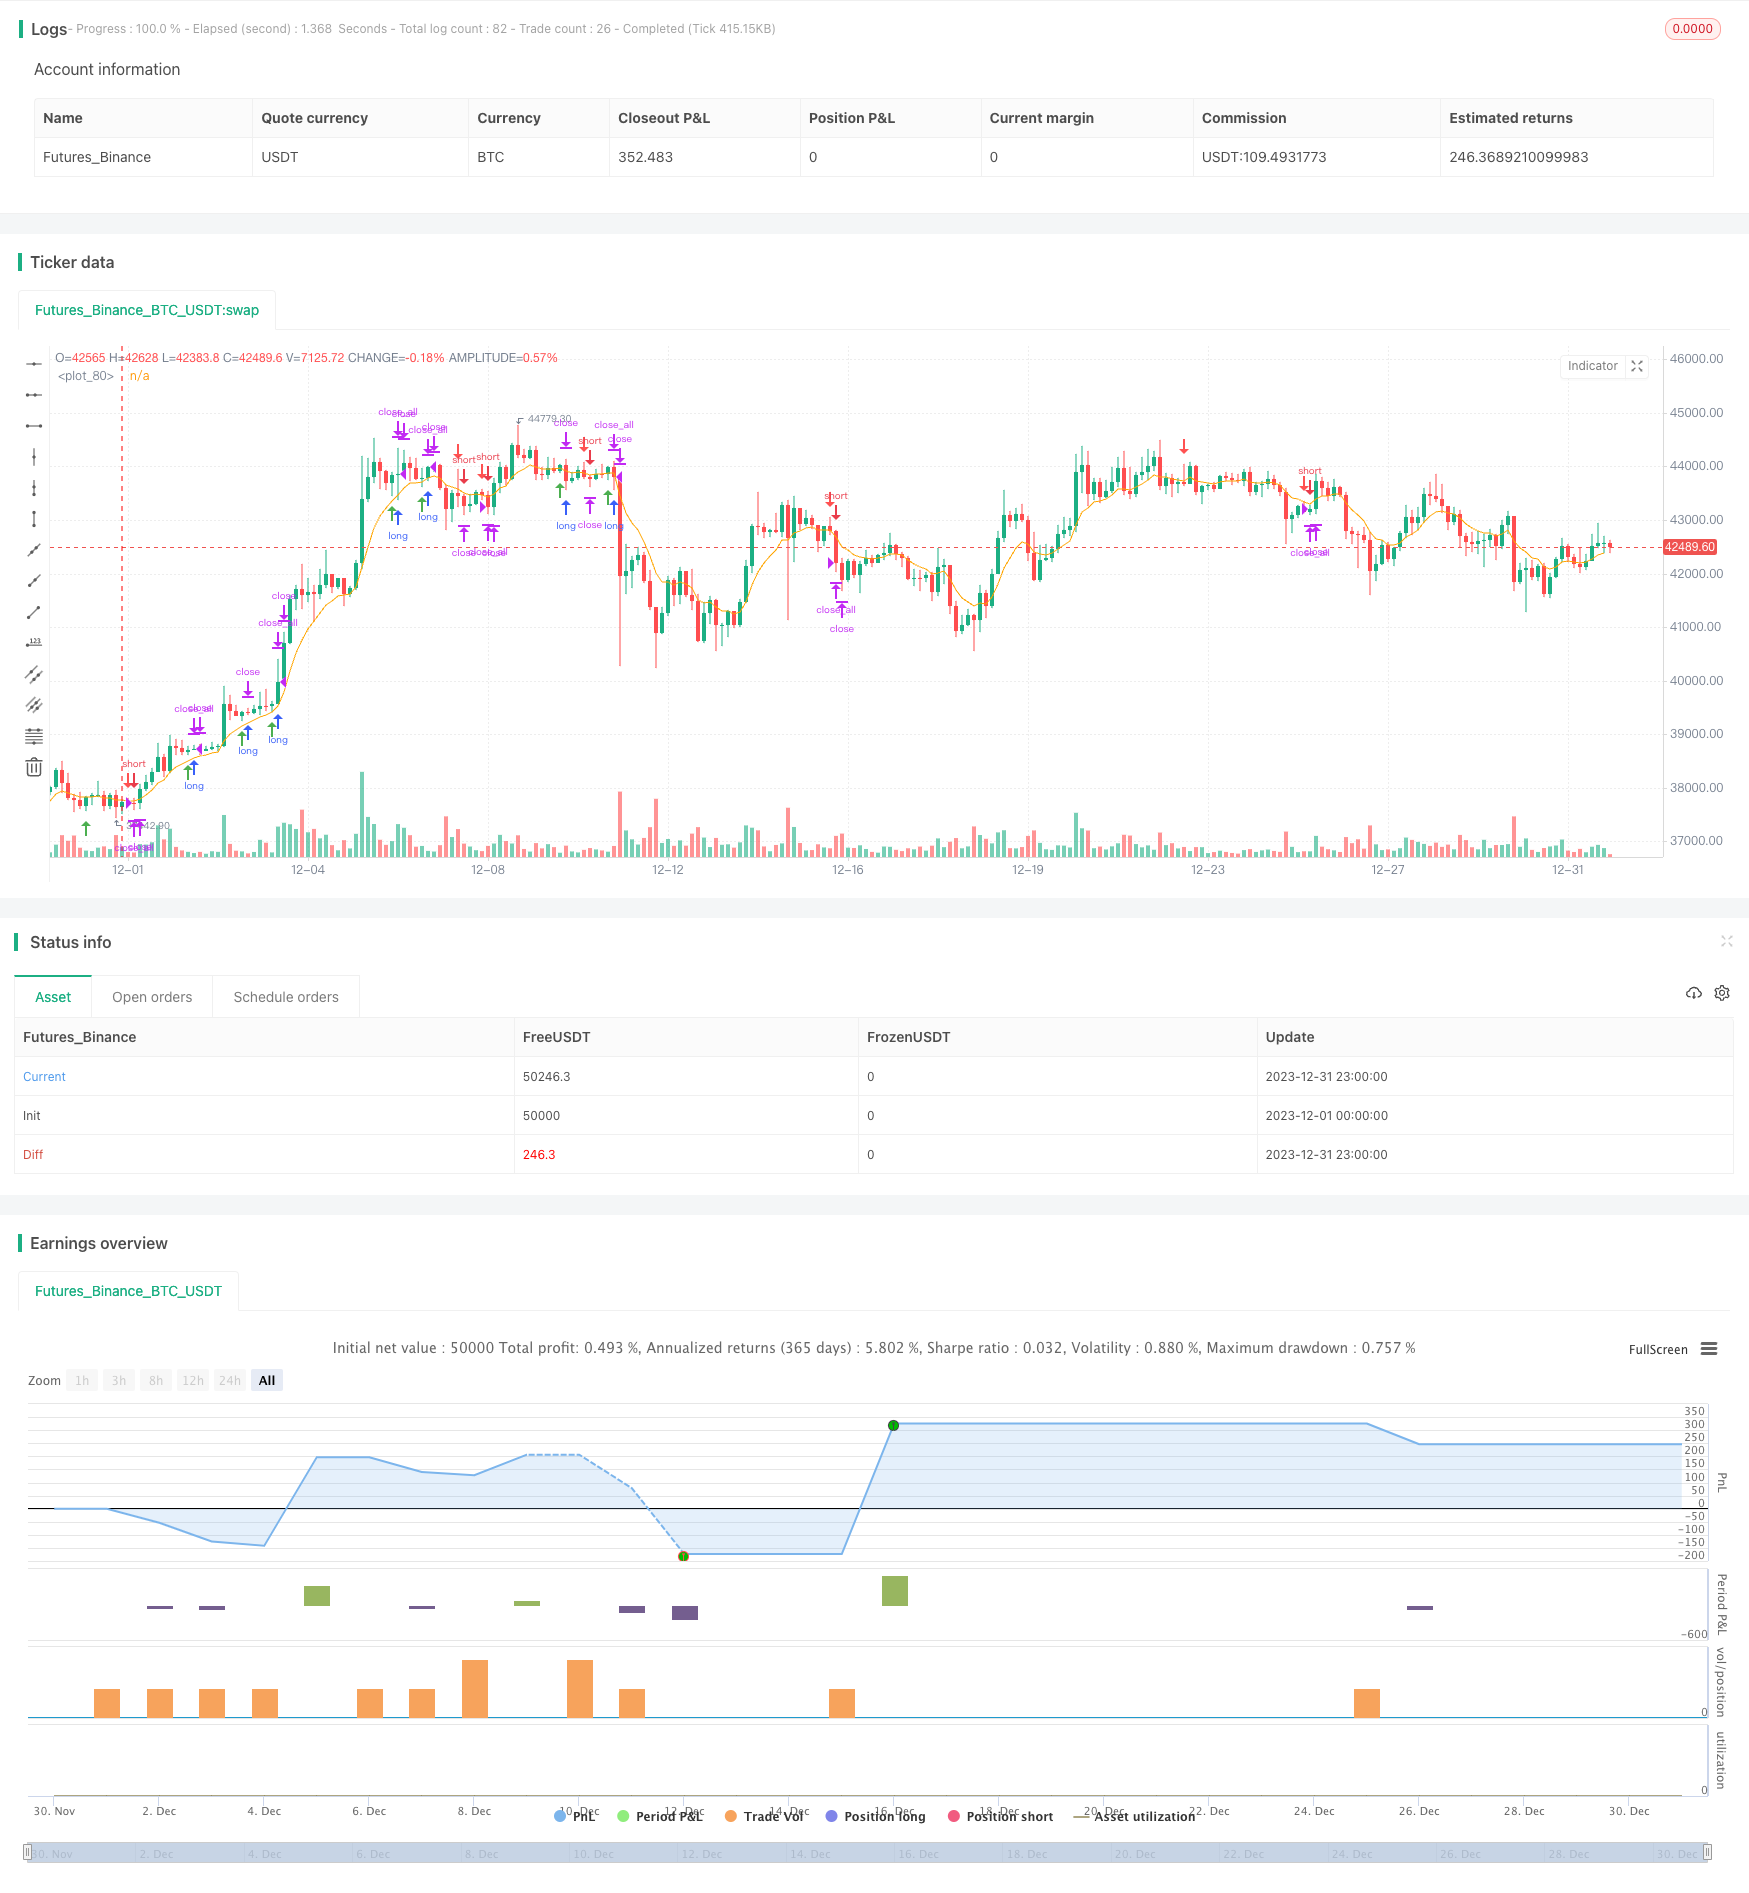
/*backtest
start: 2023-12-01 00:00:00
end: 2023-12-31 23:59:59
period: 3h
basePeriod: 15m
exchanges: [{"eid":"Futures_Binance","currency":"BTC_USDT"}]
*/

// This Pine Script™ code is subject to the terms of the Mozilla Public License 2.0 at https://mozilla.org/MPL/2.0/
// © bdrex95

//@version=5

// Rob Reversal Strategy - Official
// Using Rob Reversal Indicator: Original
// Description
// This indicator is based on the strategy created by Trader Rob on the NQ 15m chart.
//
// Timeframe for trading is 8:30am-1:15pm Central.
//
// Above the EMA line, look for a long position. You will have a short candle, then a long candle that opens below the short candle. It will have a lower high and a lower low. Once the long candle closes, your entry will be 1 tick above the wick (green line) and stop loss will be at the bottom of the bottom wick (red line).
//
// Below the EMA line, look for a short position. You will have a long candle, then a short candle that opens above the long candle. It will have a higher high and a higher low. Once the short candle closes, your entry will be 1 tick below the wick (green line) and stop loss will be at the top of the top wick (red line).
//

strategy("Trader Rob Reversal Strategy NQ 15min", shorttitle="Official Rob Rev Strat", overlay=true)


//--- Session Input ---
sess = input(defval = "0930-1415", title="Trading Session")
t = time(timeframe.period, sess)
sessionOpen = na(t) ? false : true

flat_time = input(defval = "1515-1558", title="Close All Open Trades")
ft = time(timeframe.period, flat_time)
flatOpen = na(ft) ? false : true


// Calculate start/end date and time condition
startDate = input(timestamp('2018-12-24T00:00:00'),group = "ALL STRATEGY SETTINGS BELOW")
finishDate = input(timestamp('2029-02-26T00:00:00'),group = "ALL STRATEGY SETTINGS BELOW")
time_cond = true


emaColor = input.color(color.orange, title="EMA Color")
emaLength = input.int(8, title="EMA Length")


emaInd = ta.ema(close, emaLength)


rr = input(1.0,"Enter RR",group = "TP/SL CONDITION INPUTS HERE")


sellShapeInput = input.string("Arrow", title="Sell Entry Shape", options=["Arrow", "Triangle"])
buyShapeInput = input.string("Arrow", title="Buy Entry Shape", options=["Arrow", "Triangle"])


sellShapeOption = switch sellShapeInput
    "Arrow" => shape.arrowdown
    "Triangle" => shape.triangledown

buyShapeOption = switch buyShapeInput
    "Arrow" => shape.arrowup
    "Triangle" => shape.triangleup


O = open
C = close
H = high
L = low


sellEntry = (C[1] > O[1]) and (C < O) and (H[1] < H) and (C < H[1]) and (C > L[1]) and (L > L[1]) and (C < emaInd) and sessionOpen and time_cond
buyEntry = (C[1] < O[1]) and (C > O) and (H[1] > H) and (L[1] > L) and (C < H[1]) and (C > L[1]) and (C > emaInd) and sessionOpen and time_cond


sellEntry_index = ta.valuewhen(sellEntry,bar_index,0)
sellEntry_hi = ta.valuewhen(sellEntry,high,0)
sellEntry_low = ta.valuewhen(sellEntry,low,0)
buyEntry_index = ta.valuewhen(buyEntry,bar_index,0)
buyEntry_hi = ta.valuewhen(buyEntry,high,0)
buyEntry_lo = ta.valuewhen(buyEntry,low,0)


plotshape(buyEntry, color = color.green, location = location.belowbar, style = buyShapeOption, size = size.small)
plotshape(sellEntry, color = color.red, location = location.abovebar, style = sellShapeOption, size = size.small)
plot(emaInd, color=emaColor)


// Risk Management
entry_price_long = (buyEntry_hi + syminfo.mintick)
entry_price_short = (sellEntry_low - syminfo.mintick)
long_sl_price = (buyEntry_lo-syminfo.mintick)
short_sl_price = (sellEntry_hi + syminfo.mintick)
long_tp_price = ((entry_price_long - long_sl_price)*rr) + entry_price_long
short_tp_price = entry_price_short - ((short_sl_price - entry_price_short)*rr)


long_sl_ticks = (entry_price_long - long_sl_price) / syminfo.mintick
short_sl_ticks = (short_sl_price - entry_price_short) / syminfo.mintick


long_tp_ticks = (long_tp_price - entry_price_long) / syminfo.mintick
short_tp_ticks = (entry_price_short - short_tp_price) / syminfo.mintick


// Positions
if (buyEntry)
    strategy.entry("Long", strategy.long,stop = H + syminfo.mintick)
if strategy.position_size > 0
    strategy.exit("Long Ex","Long", loss = long_sl_ticks, profit = long_tp_ticks, comment_loss = "SL Long", comment_profit = "TP Long")


if (sellEntry)
    strategy.entry("Short", strategy.short,stop = L - syminfo.mintick)
if strategy.position_size < 0
    strategy.exit("Short Ex","Short",loss = short_sl_ticks, profit = short_tp_ticks, comment_loss = "SL Short", comment_profit = "TP Short")


// Cancel order if close beyond ema
if (C < emaInd)
    strategy.cancel("Long")


if (C > emaInd)
    strategy.cancel("Short")


// Go flat at close (for futures funded account)
if strategy.position_size > 0 and flatOpen
    strategy.close_all(comment = "EOD Flat")
if strategy.position_size < 0 and flatOpen
    strategy.close_all(comment = "EOD Flat")

//END