スーパートレンド指標と単純移動平均に基づく戦略
概要
超トレンド双均線策略は,超トレンド指標とシンプル移動平均に基づいて定量的な取引策略である.この策略は超トレンド指標を使用して市場のトレンド方向を判断し,その後,200日間のシンプル移動平均と組み合わせてフィルタリングを行い,大きなトレンド方向でポジションを開き,多空を行う.
戦略原則
この戦略は2つの指標を用いています.
超トレンド指数:実際の波幅ATRと倍数に基づいて上線と下線を計算する.閉盘価格が上線より高いときは看板であり,下線より低い場合は看板である.
200日単調移動平均:近200日間の閉店価格の算術平均である.閉店価格がこの線より高くなり,大トレンドが上昇し,この線より低くなり,大トレンドが低下する.
戦略的な論理:
超トレンド指標が看板 (((超トレンド指標値が0より大きい) で,閉盘価格が200日平均線より高いとき,多頭入場する。
超トレンド指数が下落して (超トレンド指数値は0未満) そして,閉盘価格が200日平均線以下であるとき,空頭入場する.
超トレンド指標が前回の信号と逆転したときに平仓に出場する.
ストップ・ロスは25%.
優位分析
この戦略は,超トレンド指標による短期トレンドの判断と200日平均線による長期トレンドの判断を組み合わせて,偽突破を効果的にフィルターし,取引頻度を低下させながら勝利率を向上させる.大きな市場では,トレンドが十分に明確で,ストップ・ロースは大きい,利益の余地も大きい.
リスク分析
この戦略の主なリスクは,ストップ・ロスの幅が大きいこと,高レバレッジの場合,強制的な清算のリスクが増加することにある.また,市場が収束するとき,超トレンド指標は余剰信号を生じ,取引頻度とコストを増加させる.
ATR周期,倍数パラメータ,および停止幅を適切に調整することでリスクを減らすことができます.
最適化の方向
この戦略は以下の点で最適化できます.
ATR周期と倍数パラメータを調整し,超トレンド指標のパラメータを最適化します.
EMA,VIDYAなどの他の均等指標を替えてみよう.
BOLLチャネルやKD指標などの他の補助指標を追加し,信号をさらにフィルタリングする.
利回り平衡点への移動や大規模な止損などの最適化ストップ・ストラトジー.
要約する
この戦略は,全体的に非常に実用的で,短期的傾向判断と長期的傾向判断を考慮し,止損設定も合理的です.パラメータ調整と最適化により,まだより良い効果を得ることができます.
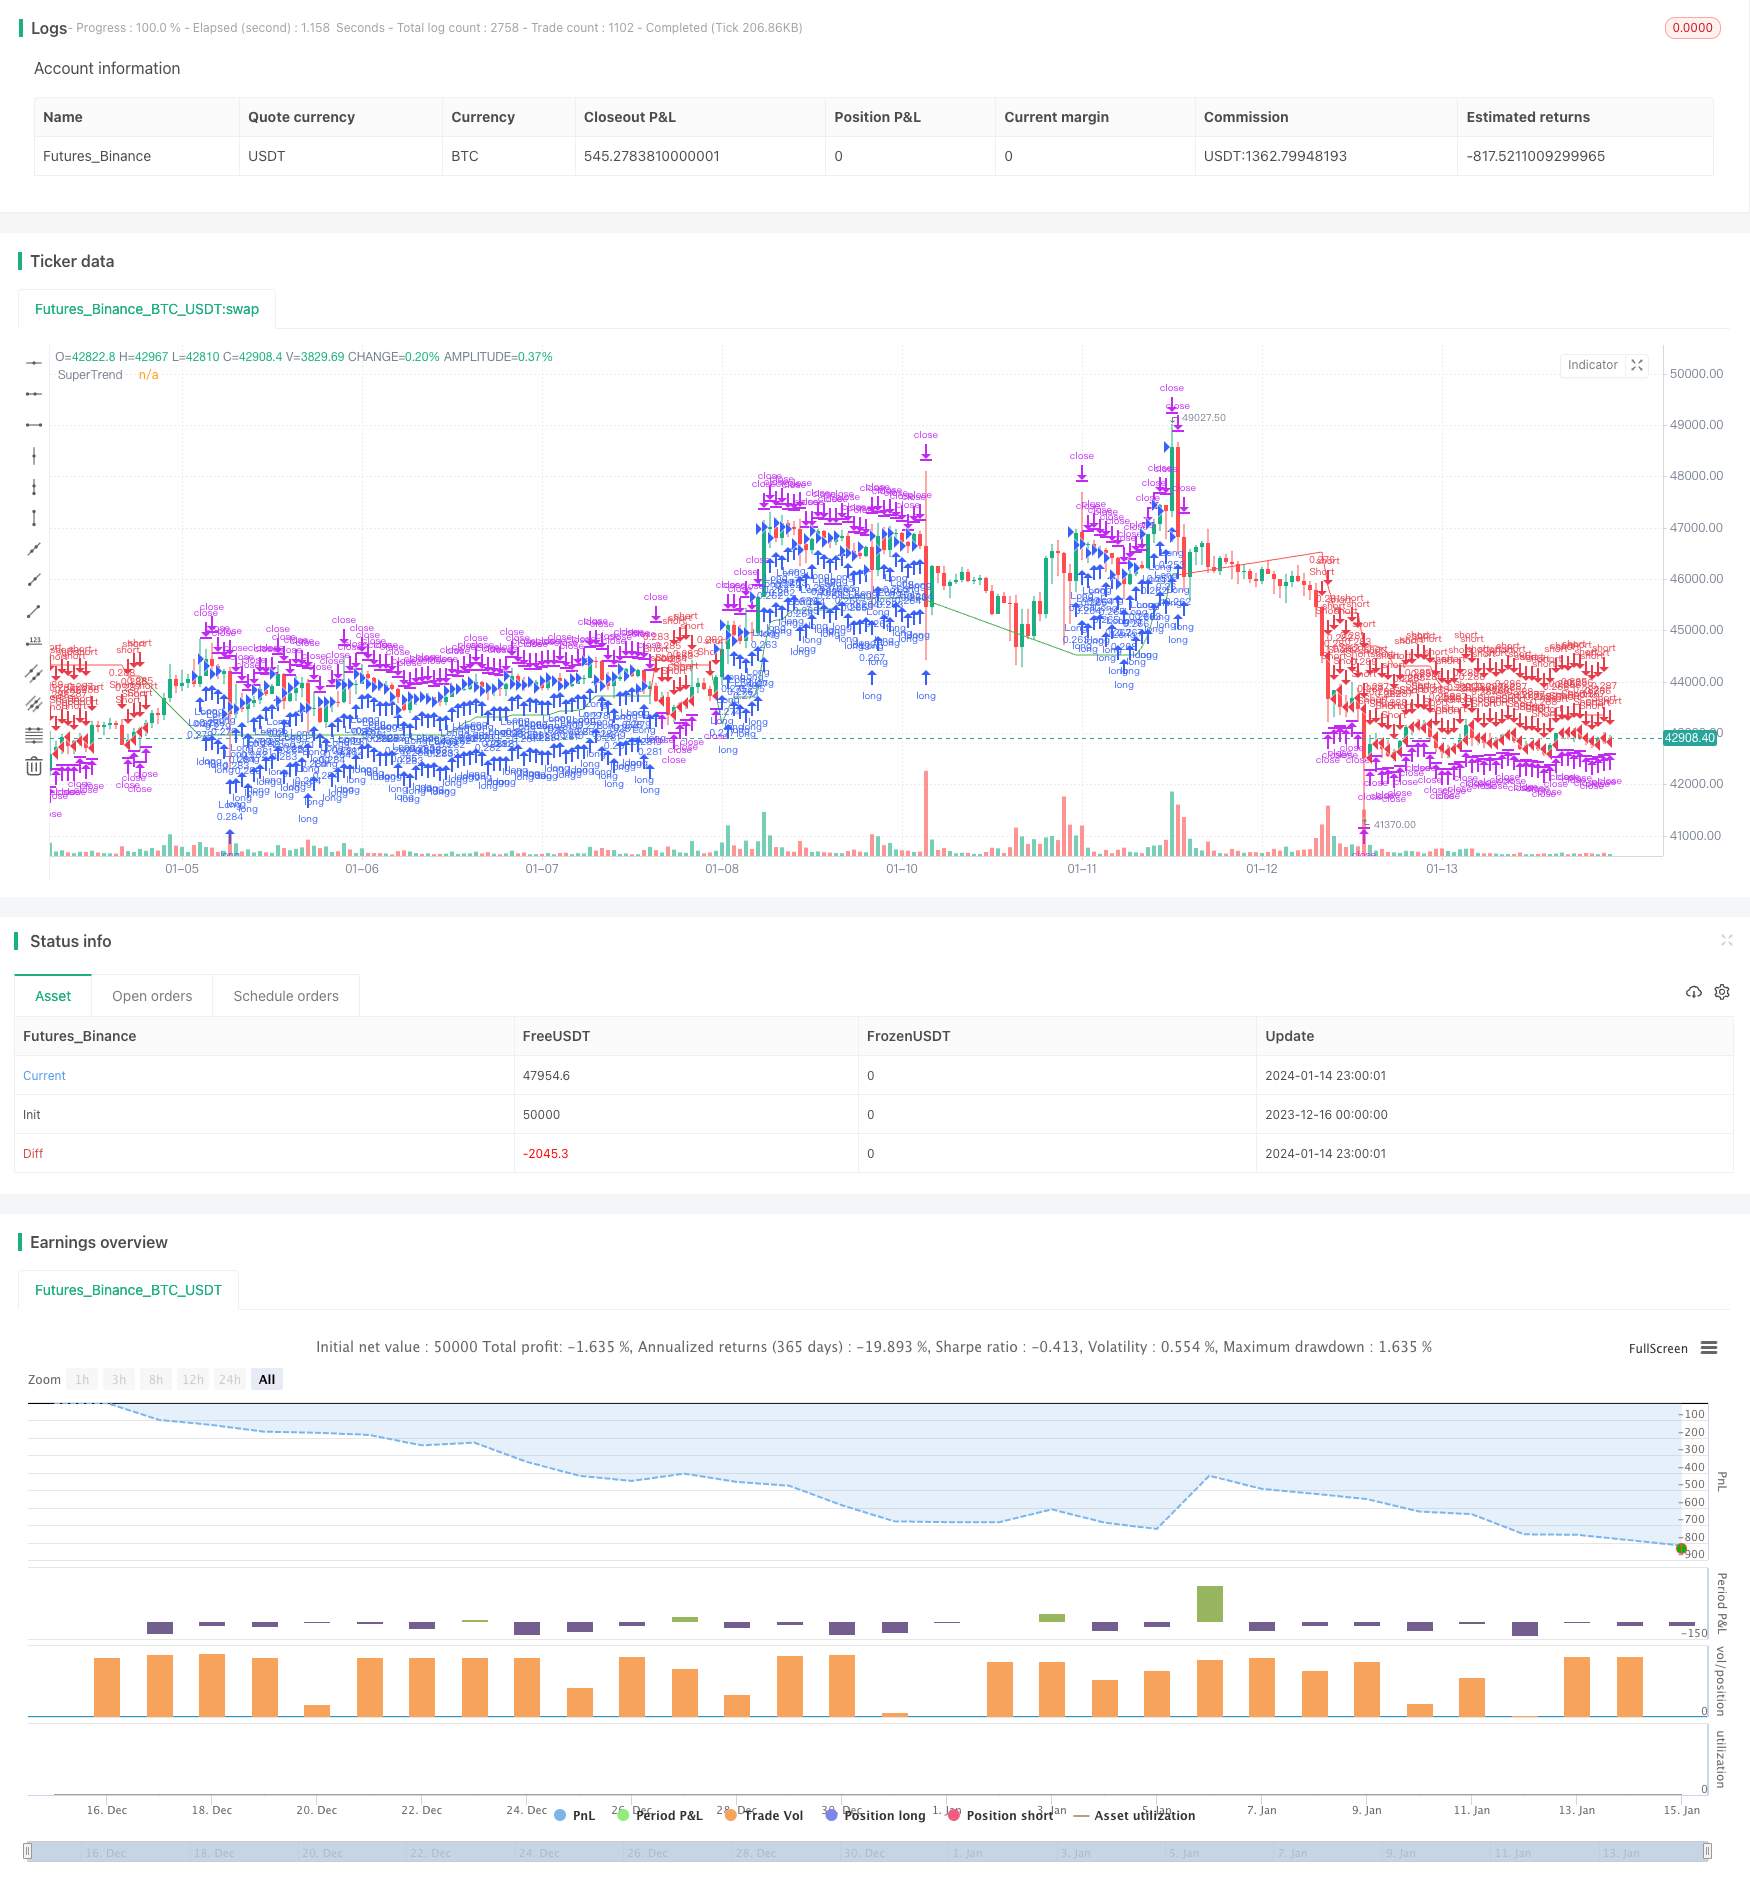
/*backtest
start: 2023-12-16 00:00:00
end: 2024-01-15 00:00:00
period: 1h
basePeriod: 15m
exchanges: [{"eid":"Futures_Binance","currency":"BTC_USDT"}]
*/

// This work is licensed under a Attribution-NonCommercial-ShareAlike 4.0 International (CC BY-NC-SA 4.0) https://creativecommons.org/licenses/by-nc-sa/4.0/
// © wielkieef

//@version=5

strategy("Smart SuperTrend Strategy ", shorttitle="ST Strategy", overlay=true, pyramiding=1, initial_capital=10000, default_qty_type=strategy.percent_of_equity, default_qty_value=25, calc_on_order_fills=false, slippage=0, commission_type=strategy.commission.percent, commission_value=0.01)


// Parametry wskaźnika SuperTrend
atrLength = input(10, title="Lenght ATR")
factor = input(3.0, title="Mult.")

// Parametry dla SMA
lengthSMA = input(200, title="Lenght SMA")

// Parametry dla Stop Loss
sl = input.float(25.0, '% Stop Loss', step=0.1)

// Obliczanie ATR
atr = ta.atr(atrLength)

// Obliczanie podstawowej wartości SuperTrend
up = hl2 - (factor * atr)
dn = hl2 + (factor * atr)

// Obliczanie 200-SMA
sma200 = ta.sma(close, lengthSMA)

// Inicjalizacja zmiennych
var float upLevel = na
var float dnLevel = na
var int trend = na
var int trendWithFilter = na

// Logika SuperTrend
upLevel := close[1] > upLevel[1] ? math.max(up, upLevel[1]) : up
dnLevel := close[1] < dnLevel[1] ? math.min(dn, dnLevel[1]) : dn

trend := close > dnLevel[1] ? 1 : close < upLevel[1] ? -1 : nz(trend[1], 1)

// Filtr SMA i aktualizacja trendWithFilter
trendWithFilter := close > sma200 ? math.max(trend, 0) : math.min(trend, 0)

// Logika wejścia
longCondition = trend == 1
shortCondition = trend == -1

// Wejście w pozycje
if (longCondition) and  close > sma200
    strategy.entry("Long", strategy.long)
if (shortCondition) and close < sma200
    strategy.entry("Short", strategy.short)

// Warunki zamknięcia pozycji
Long_close = trend == -1 and close > sma200
Short_close = trend == 1  and close < sma200

// Zamknięcie pozycji
if (Long_close)
    strategy.close("Long")
if (Short_close)
    strategy.close("Short")

// Kolory superTrendu z filtrem sma200
trendColor = trendWithFilter == 1 ? color.green : trendWithFilter == -1 ? color.red : color.blue

//ploty
plot(trendWithFilter == 1 ? upLevel : trendWithFilter == -1 ? dnLevel : na, color=trendColor, title="SuperTrend")

// Stop Loss ( this code is from author RafaelZioni, modified by wielkieef )
per(procent) =>
    strategy.position_size != 0 ? math.round(procent / 100 * strategy.position_avg_price / syminfo.mintick) : float(na)
// --------------------------------------------------------------------------------------------------------------------

strategy.exit('SL',loss=per(sl))


//by wielkieef