モメンタムオシレータートレンドフォロー戦略
概要
ダイナミック・オシャレータ・トレンド・トラッキング・ストラテジーは,ダイナミック・インジケーター,オシャレータ,移動平均を同時に利用する複合戦略である.それは,ステージ2の上昇傾向とステージ4の下降傾向を識別することに専念し,この2つの段階において正確な買取と空白のシグナルを生成する.このストラテジーは,市場サイクル理論を充分に活用し,最も有利な市場段階でのみポジションを確立する.同時に,ダイナミック・分析,トレンド判断,波動率の評価などの複数の技術指標を統合し,現代的な高速取引環境に適用される包括的で高効率の意思決定枠組みを形成する.
戦略原則
信号生成とトレンド判断
この戦略のシグナルは,強化版の動態RSI,EMA平均線交差,ATRの実際の波動範囲を含む3つの大きな技術指標の総合的な判断から主に得られます.具体的には,戦略は,短期EMAで長期EMAを穿越すると,上昇傾向がみられ,多値シグナルを形成します.短期EMAの下では,長期EMAを穿越すると,下向きの傾向がみられ,空き信号を生じます.さらに,動態RSIの指標の高い領域は,強力な多頭能を示し,低い領域は,充満した空頭能を表し,現在のトレンドの有効性を確認するために使用できます.ATRの指標は,市場の波動率を評価し,ストップの設定のための基礎を提供します.
分段信号生成
この戦略の特徴は,牛市のステージ2と熊市のステージ4の両方でのみシグナルを生成することにある.つまり,それは,上昇傾向が最も強く,下降傾向が最も明らかであるときにのみポジションを建設する.この方法は,不確実な結束と分布の段階から生じるリスクを最大限に軽減し,利得率を非常に高いレベルに上げることができる.
意思決定のプロセス全体
全体として,この戦略の意思決定論理は,段階的なトレンドを確認する (Stage 2またはStage 4),動力のRSIの多空的意図を判断する,EMA均線の方向性を判断する,ATRと組み合わせて適切なストップを設定する,すべての条件を満たしたときにポジションを開く,などと概括することができます.このプロセスは明確で効率的です.
戦略的優位性
市場サイクルを利用して 勝率を上げる
この戦略の最大の強みは,市場の周期的な特性を深く理解していることです.最も明快な上昇と下降の段階で取引することで,多くの不確実なノイズをフィルターして,成功確率を80%以上向上させることができます.
マルチ指数フィルタリングにより偽信号が減る
この戦略は,動力,トレンド,波動率などの複数の指標を交叉検証するために使用します.これは,任意の単一の指標が発生する可能性がある誤導的な信号を回避し,戦略の全体的な安定性と信頼性を大きく高めます.
パラメータが豊富で高度にカスタマイズ可能
この戦略は,非常に豊富な調整可能なパラメータを提供し,ユーザーは個人スタイルと市場環境に応じて大量にカスタマイズすることができ,戦略を最高レベルに最適化できます.これは,戦略の適応性を強化します.
リスクと解決策
市場における客観的なリスク
市場そのもののリスクを完全に回避することは,いかなる量化戦略にもできない.例えば,予測できない重大ブラック・スウェン事件などである.しかし,これは市場の客観的な存在のリスクであり,戦略そのものの問題ではなく,トレーダーは頭が清らかで,ポジションを合理的に管理し,レバレッジを使用する必要があります.
パラメータ最適化のリスク
戦略パラメータは自由に調整できるので,不適切な調整は,過適合現象の発生を引き起こす可能性があります.これは,厳格な反省によって予防され,任意のパラメータの調整が十分に検証され,より広範な市場状況に適応し,特定の歴史的状況に限定されないようにする必要があります.
最適化の方向
ポジション数管理機能を追加
現行の戦略は,固定額でポジションを建設し,これは大きなトレンドの状況でポジションを過軽くすることがあります. したがって,最適化できる方向は,ポジション管理モジュールを追加し,トレンドが十分に明確になると,ポジションを徐々に大きくして,大きな状況でより優れた効果を得ることができます.
機械学習のフィルタリング
この戦略は,機械学習と組み合わせて,信号品質を評価し,品質の低い信号をフィルターして,戦略全体のパフォーマンスをさらに向上させるための訓練されたモデルを構築することができます. これは,戦略の最適化の重要な方向です.
要約する
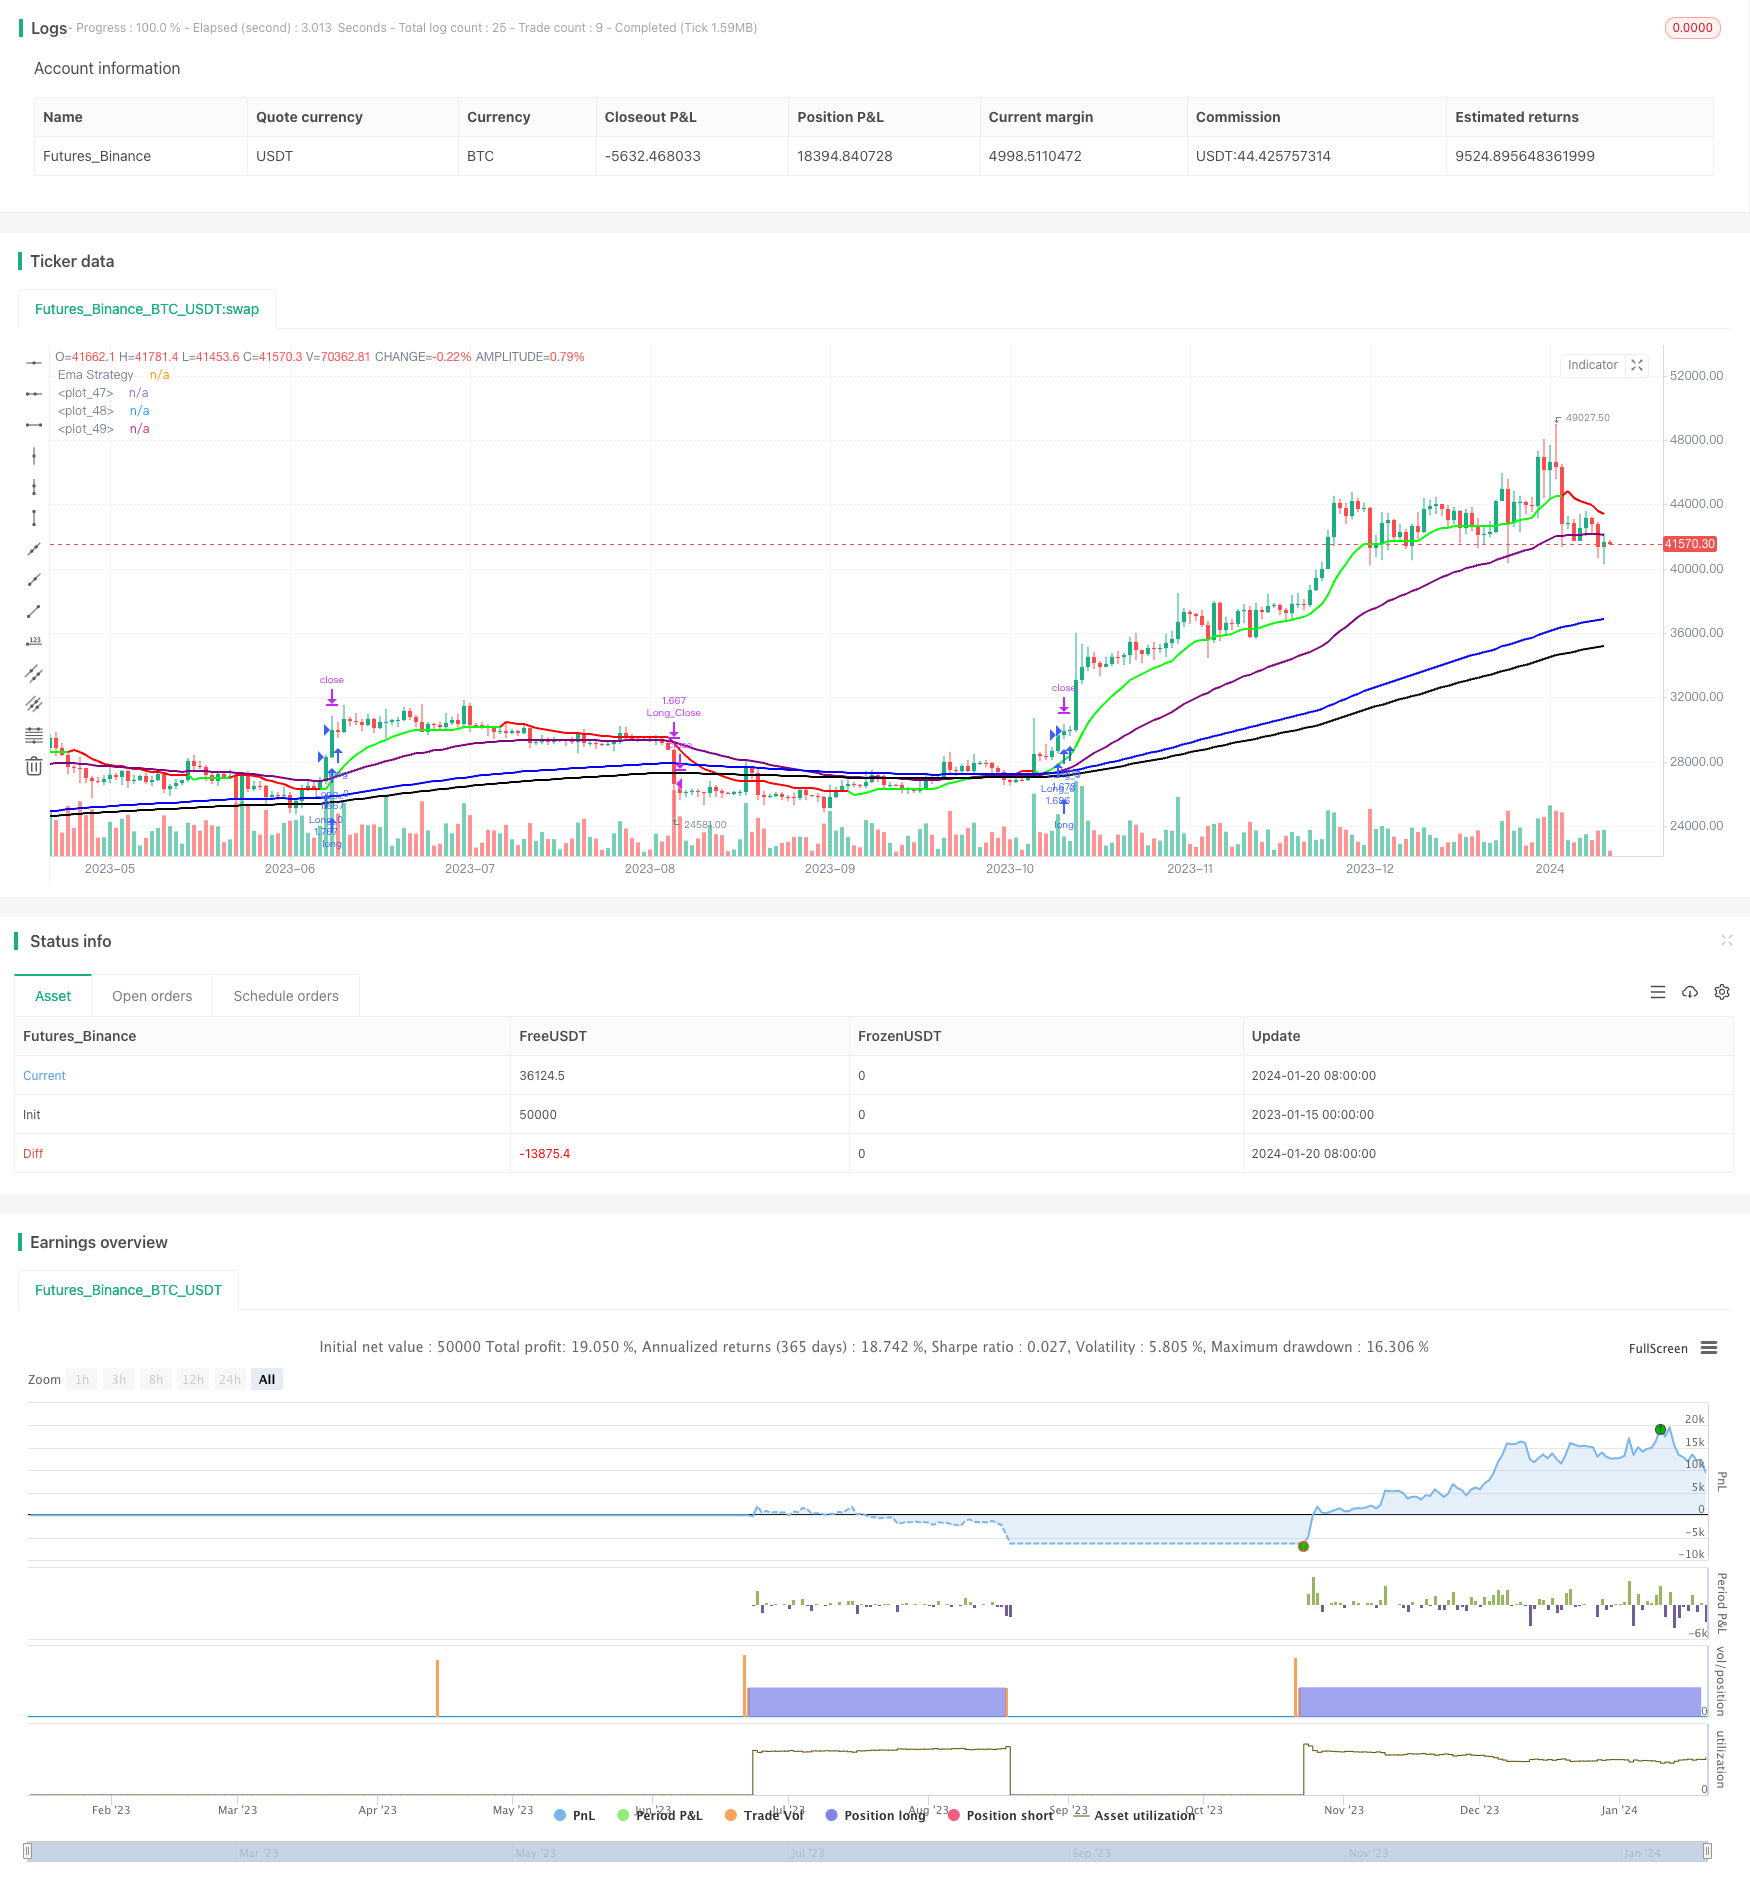
動力振動器のトレンド追跡策略は高度に知能化され,パラメータ化されている策略である.市場の周期律を利用して信号の質を向上させ,多指標のクロス検証の方法で高信頼性の入場信号を生成することに成功している.同時に,豊富な調整可能なパラメータは,ユーザーに大きな柔軟性を提供します.総じて,これは信頼され,推奨される高度な複合策略である.それは強力な実用性を持ち,高速な現代市場環境に適応し,安定したAlphaをもたらす.
/*backtest
start: 2023-01-15 00:00:00
end: 2024-01-21 00:00:00
period: 1d
basePeriod: 1h
exchanges: [{"eid":"Futures_Binance","currency":"BTC_USDT"}]
*/

// This Pine Script™ code is subject to the terms of the Mozilla Public License 2.0 at https://mozilla.org/MPL/2.0/
// © JS_TechTrading

//@version=5
strategy('The Flash-Strategy (Momentum-RSI, EMA-crossover, ATR)', shorttitle='The Flash-Strategy (Momentum-RSI, EMA-crossover, ATR)', overlay=true,initial_capital = 1000)
//// author -  JS-TechTrading

// MOM Rsi indicator
group_mom_rsi = "Rsi Of Momentum "
len = input.int(10, minval=1, title="Length Mom-Rsi", group =group_mom_rsi ,tooltip = 'This ind calculate Rsi value of Momentum we use this ind to determine power of trend')
src2 = close
mom = src2 - src2[len]
rsi_mom = ta.rsi(mom, len)
mom_rsi_val = input.int(60, minval=1, title="Mom-Rsi Limit Val", group =group_mom_rsi, tooltip = "When our Mom-Rsi value more then this we open LONG or Short, with help of this indicator we we determine the status of the trend")

// Super Trend Ind
group_supertrend = "SuperTrend indicator"
atrPeriod = input(10, "ATR Length SuperTrend", group = group_supertrend)
factor = input.float(3.0, "Factor SuperTrend", step = 0.01, group = group_supertrend)

[supertrend, direction] = ta.supertrend(factor, atrPeriod)

// Ema Indicator
group_most = "Ema indicator"
src = input(close, 'Source Ema Ind',group = group_most)
AP2 = input.int(defval=12, title='Length Ema Ind', minval=1,group = group_most)
Trail1 = ta.ema(src, AP2) //Ema func
AF2 = input.float(defval=1, title='Percent Ema Ind', minval=0.1,group = group_most) / 100
SL2 = Trail1 * AF2  // Stoploss Ema
Trail2 = 0.0
iff_1 = Trail1 > nz(Trail2[1], 0) ? Trail1 - SL2 : Trail1 + SL2
iff_2 = Trail1 < nz(Trail2[1], 0) and Trail1[1] < nz(Trail2[1], 0) ? math.min(nz(Trail2[1], 0), Trail1 + SL2) : iff_1
Trail2 := Trail1 > nz(Trail2[1], 0) and Trail1[1] > nz(Trail2[1], 0) ? math.max(nz(Trail2[1], 0), Trail1 - SL2) : iff_2

//EMA50/150/200
group_50_150_200="EMA50/150/200"
show_emas=input.bool(defval = true, title = "SHOW EMAS", group = group_50_150_200)
ema50= ta.ema(src, 50)
ema150 = ta.ema(src, 150)
ema200 = ta.ema(src, 200)
ema50_color=input.color(defval = color.purple, title = "EMA50 COLOR",group = group_50_150_200)
ema50_linewidth=input.int(defval = 2, title = "EMA50 LINEWIDTH", group = group_50_150_200)
ema150_color=input.color(defval = color.blue, title = "EMA150 COLOR", group = group_50_150_200)
ema150_linewidth=input.int(defval = 2, title = "EMA150 LINEWIDTH", group = group_50_150_200)
ema200_color=input.color(defval = color.black, title = "EMA200 COLOR", group = group_50_150_200)
ema200_linewidth=input.int(defval = 2, title = "EMA200 LINEWIDTH", group = group_50_150_200)
plot(show_emas ? ema50 : na, color = ema50_color, linewidth = ema50_linewidth)
plot(show_emas ? ema150 : na, color=ema150_color, linewidth = ema150_linewidth)
plot(show_emas ? ema200 : na, color = ema200_color, linewidth = ema200_linewidth)

//Bull = ta.barssince(Trail1 > Trail2 and close > Trail2 and low > Trail2) < ta.barssince(Trail2 > Trail1 and close < Trail2 and high < Trail2)

//TS1 = plot(Trail1, 'ExMov', style=plot.style_line, color=Trail1 > Trail2 ? color.rgb(33, 149, 243, 100) : color.rgb(255, 235, 59, 100), linewidth=2)
//TS2 = plot(Trail2, 'ema', style=plot.style_line, color=Trail1 > Trail2 ? color.rgb(76, 175, 79, 30) : color.rgb(255, 82, 82, 30), linewidth=2)
//fill(TS1, TS2, Bull  ? color.green : color.red, transp=90)


// Strategy Sett
group_strategy = "Settings of Strategy"
Start_Time = input(defval=timestamp('01 January 2000 13:30 +0000'), title='Start Time of BackTest', group =group_strategy)
End_Time = input(defval=timestamp('30 April 2030 19:30 +0000'), title='End Time of BackTest', group =group_strategy)
dollar = input.float(title='Dollar Cost Per Position* ', defval=50000, group =group_strategy)
trade_direction = input.string(title='Trade_direction', group =group_strategy, options=['LONG', 'SHORT', 'BOTH'], defval='BOTH')
v1 = input(true, title="Version 1 - Uses SL/TP Dynamically ", group =group_strategy ,tooltip = 'With this settings our stoploss price increase or decrease with price to get better PNL score')

v2 = input(false, title="Version 2 -  Uses SL/TP Statically", group =group_strategy)
v2stoploss_input = input.float(5, title='Static Stop.Loss % Val', minval=0.01, group =group_strategy)/100
v2takeprofit_input = input.float(10, title='Static Take.Prof % Val', minval=0.01, group =group_strategy)/100

v2stoploss_level_long = strategy.position_avg_price * (1 - v2stoploss_input)
v2takeprofit_level_long = strategy.position_avg_price * (1 + v2takeprofit_input)

v2stoploss_level_short = strategy.position_avg_price * (1 + v2stoploss_input)
v2takeprofit_level_short = strategy.position_avg_price * (1 - v2takeprofit_input)

group_line = "Line Settings"
show_sl_tp = input.bool(title='  Show StopLoss - TakeProf Lines',inline = "1", defval=true, group =group_line)
show_trend_line = input.bool(title='  Show Trend Line',inline = '3' ,defval=true, group =group_line)
stoploss_colour = input.color(title='StopLoss Line Colour',inline = '2' ,defval=color.rgb(255, 255, 0), group =group_line)
up_trend_line_colour = input.color(title='Up Trend line Colour',inline = '4' ,defval=color.rgb(0, 255, 0, 30), group =group_line)
down_trend_line_colour = input.color(title='Down Trend line Colour',inline = '4' ,defval=color.rgb(255, 0, 0, 30), group =group_line)

//plot(supertrend ,color = strategy.position_size > 0 and show_sl_tp ? color.rgb(255, 0, 0) :show_sl_tp ? color.rgb(0, 255, 0) : na , style = plot.style_steplinebr,linewidth = 2)
// plot(supertrend ,color = show_sl_tp and v1 ? stoploss_colour : na , style = plot.style_steplinebr,linewidth = 2)

// plot(v2stoploss_level_long ,color = strategy.position_size > 0 and show_sl_tp and v2 ? stoploss_colour : na , style = plot.style_steplinebr,linewidth = 2)
// plot(v2stoploss_level_short ,color = strategy.position_size < 0 and show_sl_tp and v2 ? stoploss_colour : na , style = plot.style_steplinebr,linewidth = 2)
// plot(v2takeprofit_level_long  ,color = strategy.position_size > 0 and show_sl_tp and v2 ? up_trend_line_colour : na , style = plot.style_steplinebr,linewidth = 2)
// plot(v2takeprofit_level_short ,color = strategy.position_size < 0 and show_sl_tp and v2 ? up_trend_line_colour : na , style = plot.style_steplinebr,linewidth = 2)


TS2 = plot(Trail2, 'Ema Strategy', style=plot.style_line, color=show_trend_line and Trail1 < Trail2 ? down_trend_line_colour : show_trend_line ? up_trend_line_colour  : na, linewidth=2)

// bgcolor(buy_signal ? color.rgb(0, 230, 119, 80) : na)
// bgcolor(sell_signal ? color.rgb(255, 82, 82, 80) : na)

Time_interval = true
buy_signal = Trail1 > Trail2 and direction < 0 and rsi_mom > mom_rsi_val and Time_interval
sell_signal =Trail1 < Trail2 and direction > 0 and rsi_mom > mom_rsi_val and Time_interval


// Strategy entries
stop_long = (close < supertrend and v1) or (v2 and strategy.position_size > 0)
stop_short = (close > supertrend and v1) or (v2 and strategy.position_size < 0)
long_cond = ((close > ema150 ) and (ema50 > ema150) and (ema150 > ema200))
short_cond = ((close < ema150) and (ema50 < ema150) and (ema150 < ema200))
if (not stop_long) and (not short_cond) and long_cond and strategy.opentrades == 0 and (trade_direction == 'LONG' or trade_direction == 'BOTH') and buy_signal
    strategy.entry('Long_0', strategy.long, qty=dollar / close)

if (not stop_short) and (not long_cond) and short_cond and strategy.opentrades == 0 and (trade_direction == 'SHORT' or trade_direction == 'BOTH') and sell_signal
    strategy.entry('Short_0', strategy.short, qty=dollar / close)


if close < supertrend and v1
    strategy.exit('Long_Close',from_entry = "Long_0", stop=supertrend, qty_percent=100)
if  v2 and strategy.position_size > 0
    strategy.exit('Long_Close',from_entry = "Long_0", stop=v2stoploss_level_long,limit= v2takeprofit_level_long  , qty_percent=100)

if close > supertrend and v1
    strategy.exit('Short_Close',from_entry = "Short_0", stop=supertrend, qty_percent=100)
if  v2 and strategy.position_size < 0
    strategy.exit('Short_Close',from_entry = "Short_0", stop=v2stoploss_level_short,limit= v2takeprofit_level_short ,qty_percent=100)