リバーサルコモディティチャネルインデックス取引戦略

1
Follow
1789
Followers
概要
この戦略は,商品通路指数 (CCI) の指標に基づいて市場の周期性および季節性特性を識別し,サイクルの始まりと終わりを捉えます.それは,移動平均と可能と実際の取引範囲を反映する除数を組み合わせて最終的な指数を形成し,それによって通常のレベルからの偏差を測定し,主要なトレンドの変化を示します.
戦略原則
商品通路指数 (CCI) 値は,その平均価格に対する取引方法を示すツールである.CCI値が高いときは,平均価格よりも高い価格を示す;CCI値が低いときは,平均価格よりも低い価格を示す.CCI値は,通常,300から300の範囲を超えない.
この戦略は,長さ10のCCI指数と,長さ10と20の単純な移動平均を使用する. 遅い移動平均が速い移動平均より低くなるときは多行し,遅い移動平均が速い移動平均より高くなるときは空白する. 入力設定で多行を空白して反転させることができる.
優位分析
- CCI指標を使用すると,周期的な特徴とトレンドの転換点を効果的に識別できます.
- 偽信号を減らすために,双動平均と組み合わせたフィルタリング
- 異なる市場環境に対応する多引数または空白方向の選択を許可します.
- リスクはコントロール可能で 止まるポイントは明確です
リスク分析
- CCI指数は価格変動が大きい株に悪影響を与える可能性がある
- 移動平均は後退し,トレンドの転換点を逃しているかもしれない.
- 価格が過大評価されているか過小評価されているか判断できない.
- 大周期のストップダストは突破されるかもしれない
CCIパラメータまたは移動平均周期を調整することによって最適化したり,他の技術指標を加えることで資金面を判断することができる。また,より高い時間枠で全体的なトレンドを決定し,大周期で被套を避けることができる。
最適化の方向
- CCI指標のパラメータを最適化して,異なる周期と変動率に対応
- 移動平均周期を最適化し,遅滞とノイズをバランスする
- 電力量増計などの判断は 真の突破
- より高い時間枠で全体的なトレンドを決定する
要約する
この戦略は,CCI指標と双移動平均を判断して周期的な特性を利用し,短期的なトレンドを効果的に識別できる. ルールがシンプルで明確であり,パラメータは柔軟に調整され,リスクは簡単に管理される. しかし,いくつかの遅れや誤判の可能性もあります.指標パラメータを調整し,より多くの技術指標または基本的判断と組み合わせることで,よりよい効果を得ることができます.
Source
Pine
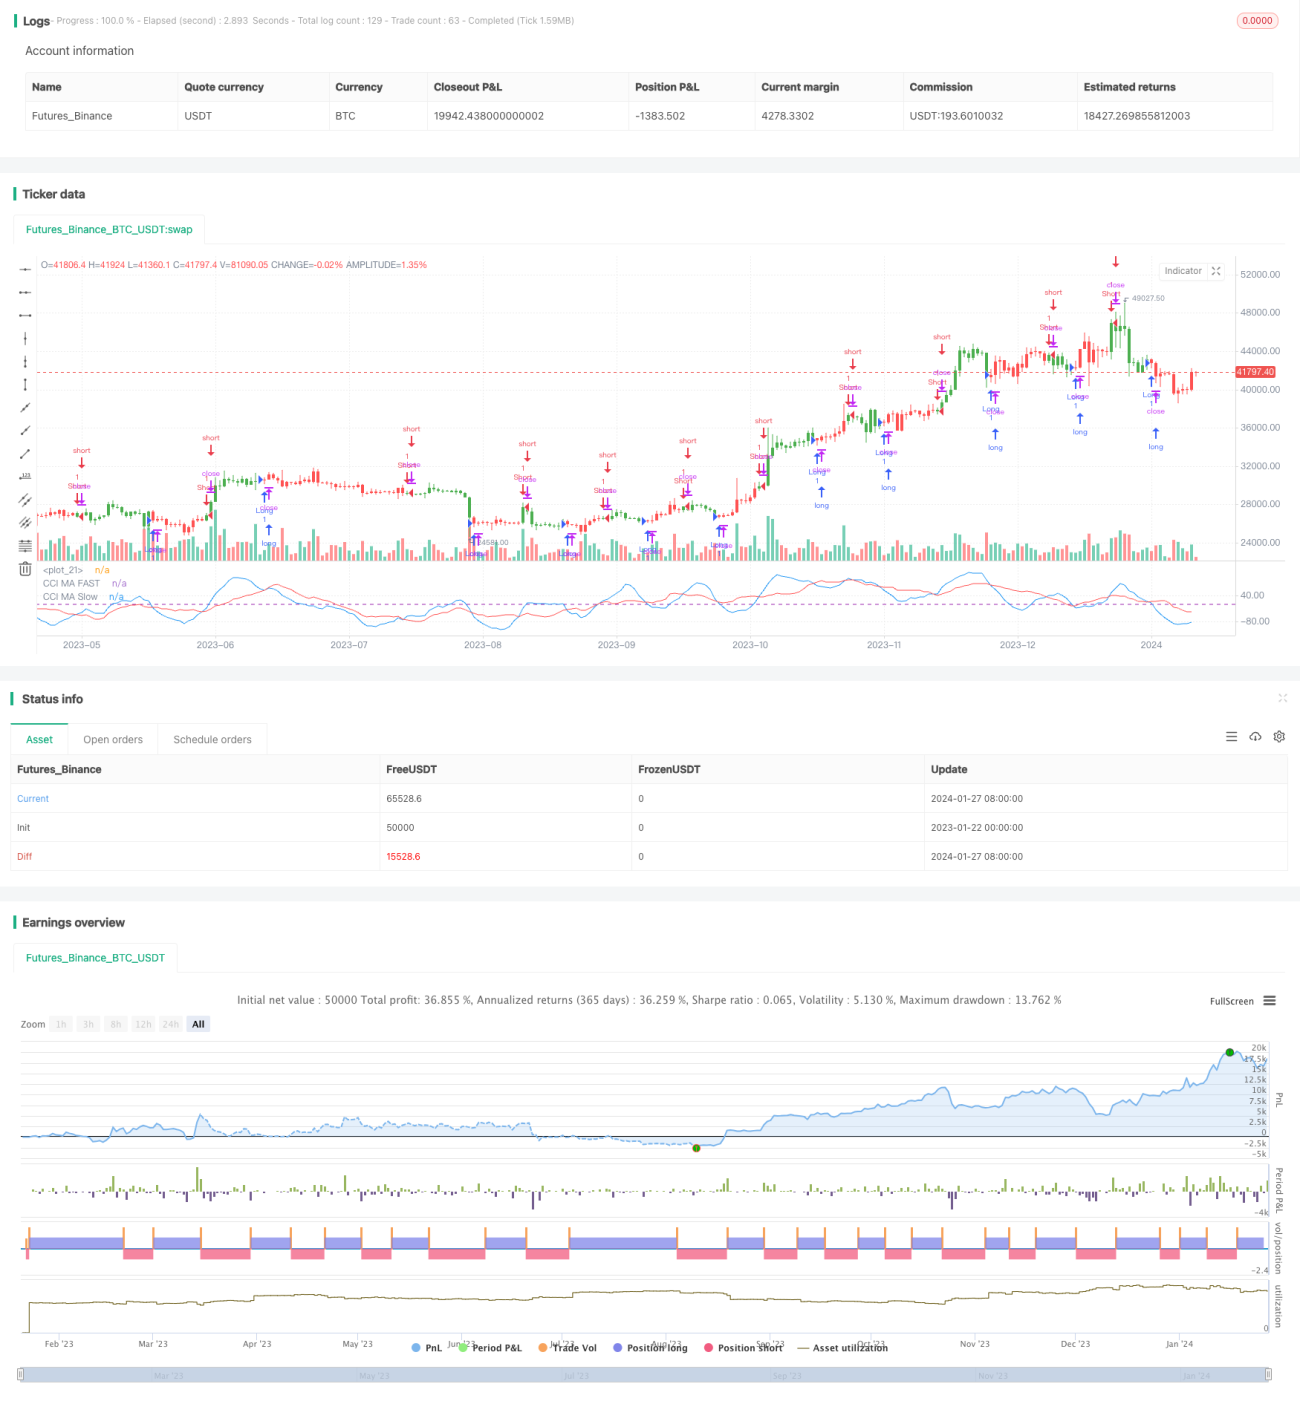
/*backtest
start: 2023-01-22 00:00:00
end: 2024-01-28 00:00:00
period: 1d
basePeriod: 1h
exchanges: [{"eid":"Futures_Binance","currency":"BTC_USDT"}]
*/

//@version = 2
////////////////////////////////////////////////////////////
//  Copyright by HPotter v1.0 30/11/2016
// The Commodity Channel Index (CCI) is best used with markets that display cyclical or Strategy parameters
Related strategies
Comment
All comments (0)
No data
- 1