KDJポジティブライン突破買い戦略
概要
KDJ陽線突破買取戦略は,KDJ指数に基づいた量化取引戦略である.この戦略は,主にKDJ指数のJ線とD線の黄金の交差を用い,買取信号を形成し,J線をD線を突破する際に多入場を行う.この戦略は,単純で,実行が容易で,量化取引の初心者向けである.
戦略原則
この戦略で使用される主な技術指標は,KDJ指標である.KDJ指標は,K線,D線,J線を含む.
K値= (当日の閉店価格-N日の最低価格) ÷ (N日の最高価格-N日の最低価格) ×100;
D値はK値のM日間移動平均である.
J値=3K-2D。
KDJ指標の設定では,J値がD値を越えると,株価が反転して上昇することを示し,多額の取引を行うことができる.J値がD値を下回ると,株価が反転して下落することを示し,空白を行うことができる.
この策略は,上記の規則を利用して,J線でD線を貫くとき,すなわち金叉が形成されたとき,購入信号として判断し,多入場を行う。 exitsignalがJ線より100大きいとき,多出場を行う。
戦略的優位性
購入のタイミングを判断するために,KDJ指数を使用し,この指数は,株価の変動情報を考慮して総合的に比較され,信頼性が高い.
戦略信号判断のルールがシンプルでわかりやすく,実装が分かりやすく,量子取引の初心者にも適しています.
ストップ・ストップ・ロスの戦略により,リスクが効果的に管理されます.
戦略のパラメータを最適化できる空間があり,柔軟に実施できる.
戦略リスク
KDJ指数は誤信号が発生し,損失を招く可能性があります.
購入後の市場ショートラインの調整により,ストップ・ロスの退出が起こり,大きなトレンドを捉えられなくなります.
パラメータの設定を間違えた場合,取引が頻繁になるか,信号が不明になる可能性があります.
取引コストが収益に与える影響に注目してください.
主要なリスク管理方法:合理的な最適化パラメータ,追跡指数強化,適切な緩解の止損範囲など.
最適化の方向
KDJのパラメータを最適化し,最適なパラメータ組み合わせを探します.
フィルタリング条件を追加し,偽信号を回避する.他の指標または形状と組み合わせてフィルタリングすることができる.
市場タイプによって異なるパラメータ設定を選択できます.
ストップ・ロスの幅は,ストップ・ロスの退出の可能性を減らすために,適当に緩和することができる.
取引量などの指標の分析と組み合わせることで,偽装を回避できます.
要約する
KDJ陽線突破買い戦略は,全体的に比較的シンプルで実用的で,手軽に実装され,特に量化取引の初心者にとって適しています. この戦略には一定の取引優位性がありますが,いくつかのリスクもあります.戦略の価値を完全に発揮するためには,標的的に最適化する必要があります. 全体的に,この戦略は,研究と応用に重点を置く価値がある.
/*backtest
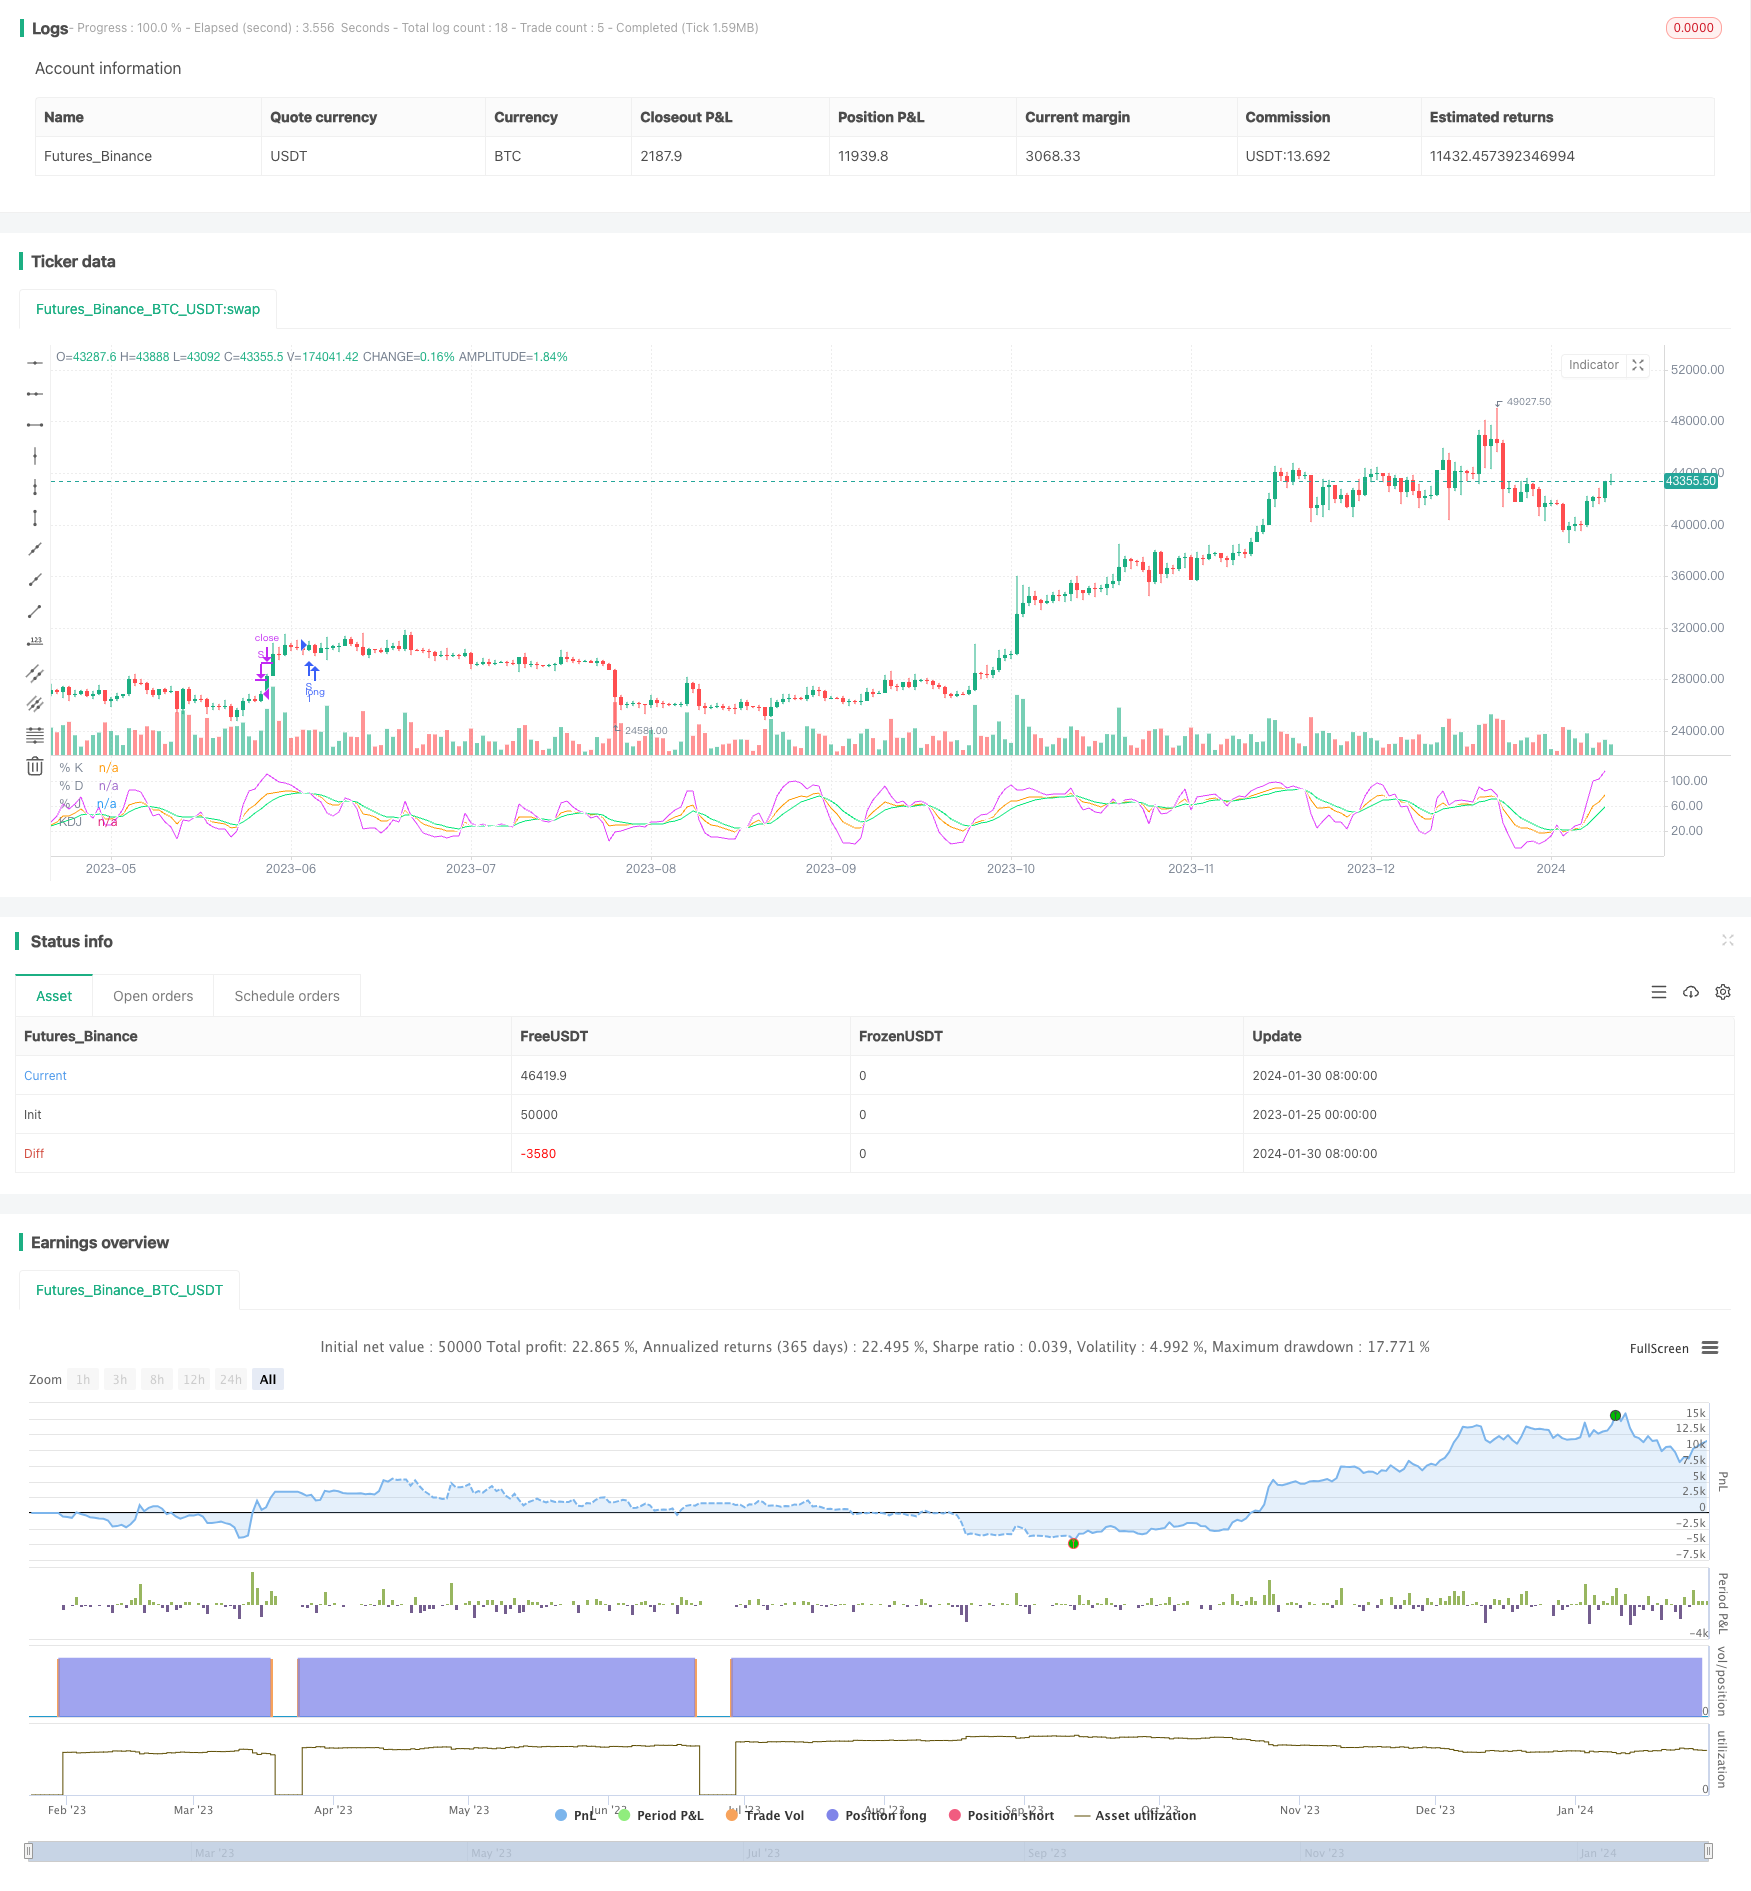
start: 2023-01-25 00:00:00
end: 2024-01-31 00:00:00
period: 1d
basePeriod: 1h
exchanges: [{"eid":"Futures_Binance","currency":"BTC_USDT"}]
*/
// ## !<------------------ Script -------------------------->
//@version=5
strategy('KDJ NVDA', shorttitle='KDJ')
ilong = input(9, title='period')
isig = input(3, title='signal')
bcwsma(s, l, m) =>
_bcwsma = float(na)
_s = s
_l = l
_m = m
_bcwsma := (_m * _s + (_l - _m) * nz(_bcwsma[1])) / _l
_bcwsma
// profit strategy add
profit_m = input.float(1.20,"Profit Margin",minval=1.0,maxval=1.99,step=0.05)
stop_m = input.float(0.98,"Stop Loss Margin",minval=0.0,maxval=1,step=0.05)
// Make input options that configure backtest date range
startDate = input.int(title="Start Date", defval=1, minval=1,maxval=31)
startMonth = input.int(title="Start Month", defval=1,minval=1,maxval=12)
startYear = input.int(title="Start Year", defval=2023,minval=2018,maxval=2024)
endDate = input.int(title="End Date", defval=1, minval=1,maxval=31)
endMonth = input.int(title="End Month", defval=1,minval=1,maxval=12)
endYear = input.int(title="End Year", defval=2024,minval=2018,maxval=2099)
// intialization of variables
// Look if the close time of the current bar
// falls inside the date range
inDateRange = (time >= timestamp(syminfo.timezone, startYear,startMonth, startDate, 0, 0)) and (time < timestamp(syminfo.timezone, endYear, endMonth, endDate, 0, 0))
c = close
h = ta.highest(high, ilong)
l = ta.lowest(low, ilong)
RSV = 100 * ((c - l) / (h - l))
pK = bcwsma(RSV, isig, 1)
pD = bcwsma(pK, isig, 1)
pJ = 3 * pK - 2 * pD
KDJ = math.avg(pD, pJ, pK)
go_long= ta.crossunder(pD,pJ)
if (inDateRange and go_long)
strategy.entry("S",strategy.long,comment="C")
// strategy.exit("S", limit=c*profit_m, stop=c*stop_m, comment="SL/SP")
if (inDateRange and pJ > 100)
strategy.close("S", comment="TP")
// Plot options
// plot(pK, color= #1E88E5)
// plot(pD, color=#FF6F00)
// plot(ma, color=color.yellow)
// bgcolor(pJ>pD? color.green : color.red)
plot(pK, title='% K', color=color.new(color.orange, 0))
plot(pD, title='% D', color=color.new(color.lime, 0))
plot(pJ, title='% J', color=color.new(color.fuchsia, 0))
plot(KDJ, title='KDJ', color=color.new(color.white, 0))
// </PINE> </SCRIPT>
// ## This source code is subject to the terms of the ozilla Public License 2.0 at https://mozilla.org/MPL/2.0/
// ## !<------------------ End Script -------------------------->