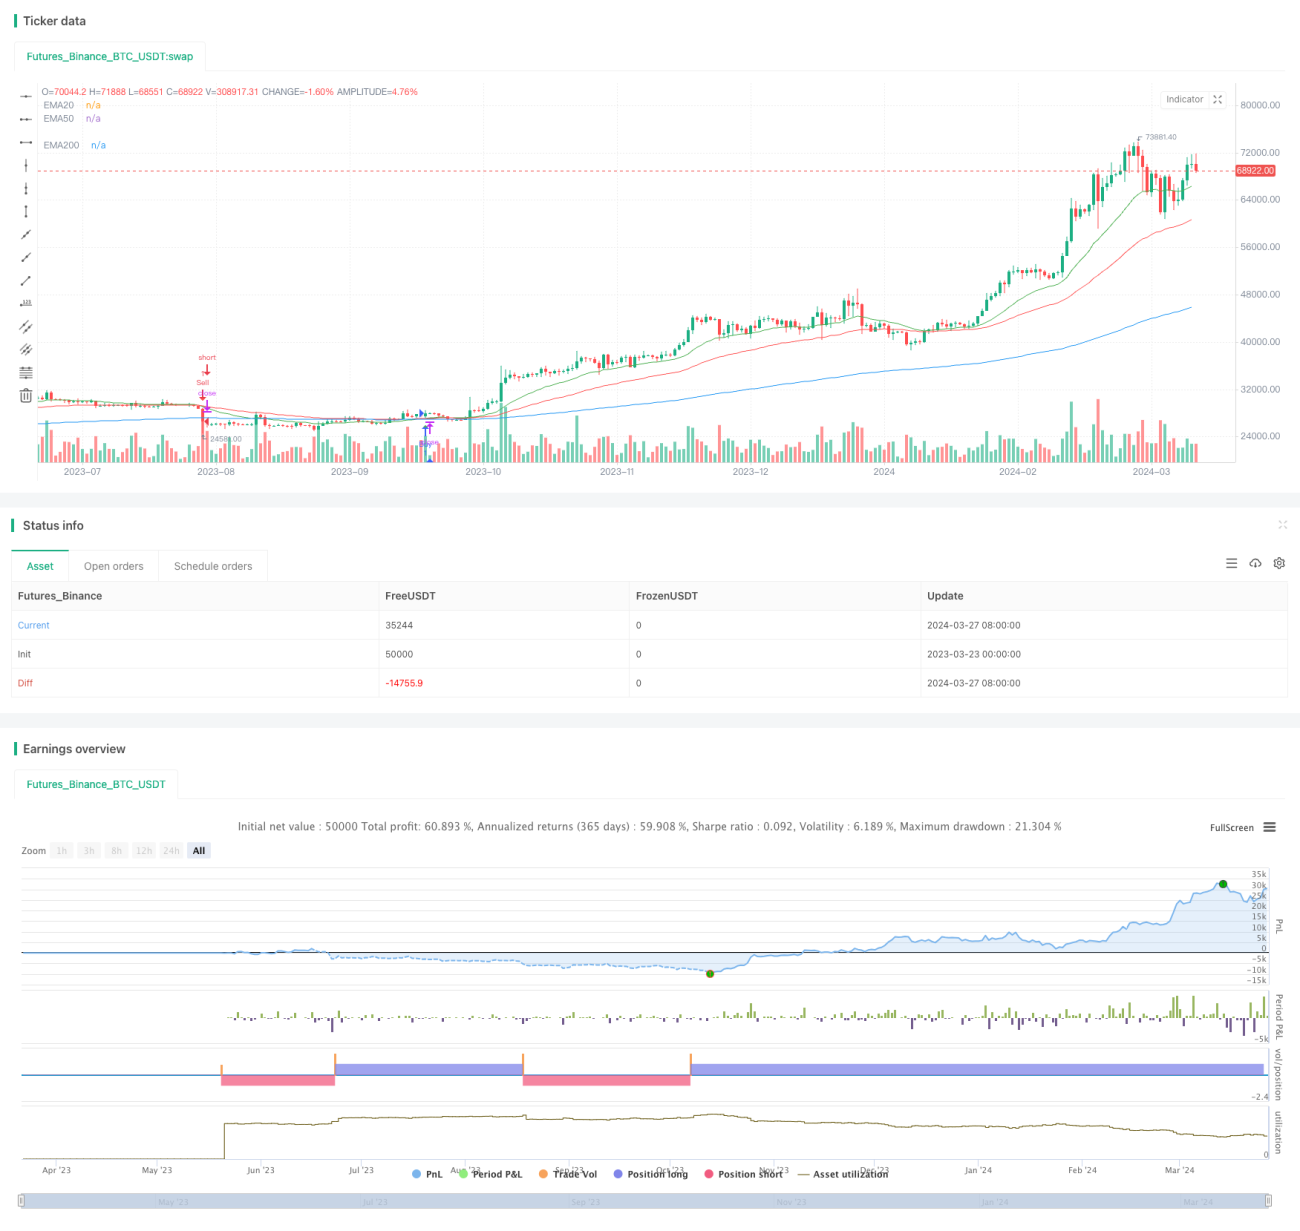
EMA ダブル移動平均クロスオーバー戦略

1
Follow
1782
Followers
概要
この戦略は,2つの移動平均線 (EMA) の交差を基に取引信号を生成する.短期EMA (20日) が下から上へと長いEMA (50日) を渡るときは,買入信号を生成する.短期EMAが上から下へと長いEMAを渡るときは,売り信号を生成する.同時に,この戦略は,200日間のEMAを長期トレンドの参考として描画する.この戦略の主な考え方は,異なる周期移動平均線の交差を利用して市場トレンドの転換を捕捉し,取引を行うことである.
戦略原則
- 20日EMA,50日EMA,および200日EMAを計算する.
- 20日EMAと50日EMAの交差点を判断する:
- 20日間のEMAが50日間のEMAを上から横切ると,買取シグナルが生成されます.
- 20日EMAが50日EMAを上から下へと突破すると,セールシグナルが生成されます.
- 20日間のEMA (緑),50日間のEMA (赤),200日間のEMA (青) をグラフに描いて,その動きと交差を直視的に観察してください.
- 買入と売却のシグナルが発生した際には,グラフに該当する買入 (上緑の三角) と売出 (下赤の三角) をマークする.
戦略的優位性
- シンプルで理解しやすい: 戦略はシンプルな移動平均の交差原理に基づいています.
- トレンド追跡:短期と長期の移動平均の交差によって,戦略は市場トレンドの転換をよりよく捉えることができ,トレンド市場で使用するのに適しています.
- 長期トレンド参照:戦略は,200日間のEMAを長期トレンド参照として導入し,現在の市場環境の判断に役立ちます.
- 直観的な表示:戦略は,移動平均と買入シグナルをグラフに明確に描画し,トレーダーが直観的に観察し分析できるようにする.
戦略リスク
- 振動市場:振動市場では,移動平均の頻繁な交差が偽信号を多く発生させ,戦略の不良なパフォーマンスを引き起こす可能性があります.
- 遅滞性:移動平均は遅滞性があり,市場転換の最適なタイミングを逃す可能性があります.
- パラメータ感性: 戦略のパフォーマンスは,移動平均の周期選択に依存し,異なる周期パラメータは,異なる結果につながる可能性があります.
戦略最適化の方向性
- 他の指標の導入: 信号の信頼性と正確性を高めるために,RSI,MACDなどの他の技術指標の導入を検討することができます.
- 最適化パラメータ:移動平均の周期パラメータを最適化して,現在の市場状況に最も適したパラメータの組み合わせを見つける.
- ストップとストップの追加: 単一取引のリスクと収益を制御するために,合理的なストップとストップのメカニズムを戦略に追加します.
- トレンド判断:長期トレンド (例えば200日EMA) に基づいて,取引信号をフィルターし,トレンドの方向のみで取引する.
要約する
EMA双均線交差策略は,簡単で分かりやすい,トレンド市場に適した取引策策である.短期および長期の移動平均の交差を活用して,市場動向の変化を捉え,長期のトレンド参照を導入する.この策略には,波動的な市場での不良なパフォーマンス,移動平均の遅れなどのいくつかの限界があるにもかかわらず,他の指標を導入し,パラメータを最適化し,リスク管理措置を加えるなどの方法で,戦略の安定性と収益性をさらに向上させることができる.
Source
Pine
Strategy parameters
Related strategies
Comment
All comments (0)
No data
- 1