RSIとボリンジャーバンドのデュアル戦略

RSI BB SMA stdev
作成日: 2024-04-03 17:54:52 最終変更日: 2024-04-03 17:54:52
コピー: 0 クリック数: 928
1
フォロー
1617
フォロワー

RSIとボリンジャーバンドのデュアル戦略

概要

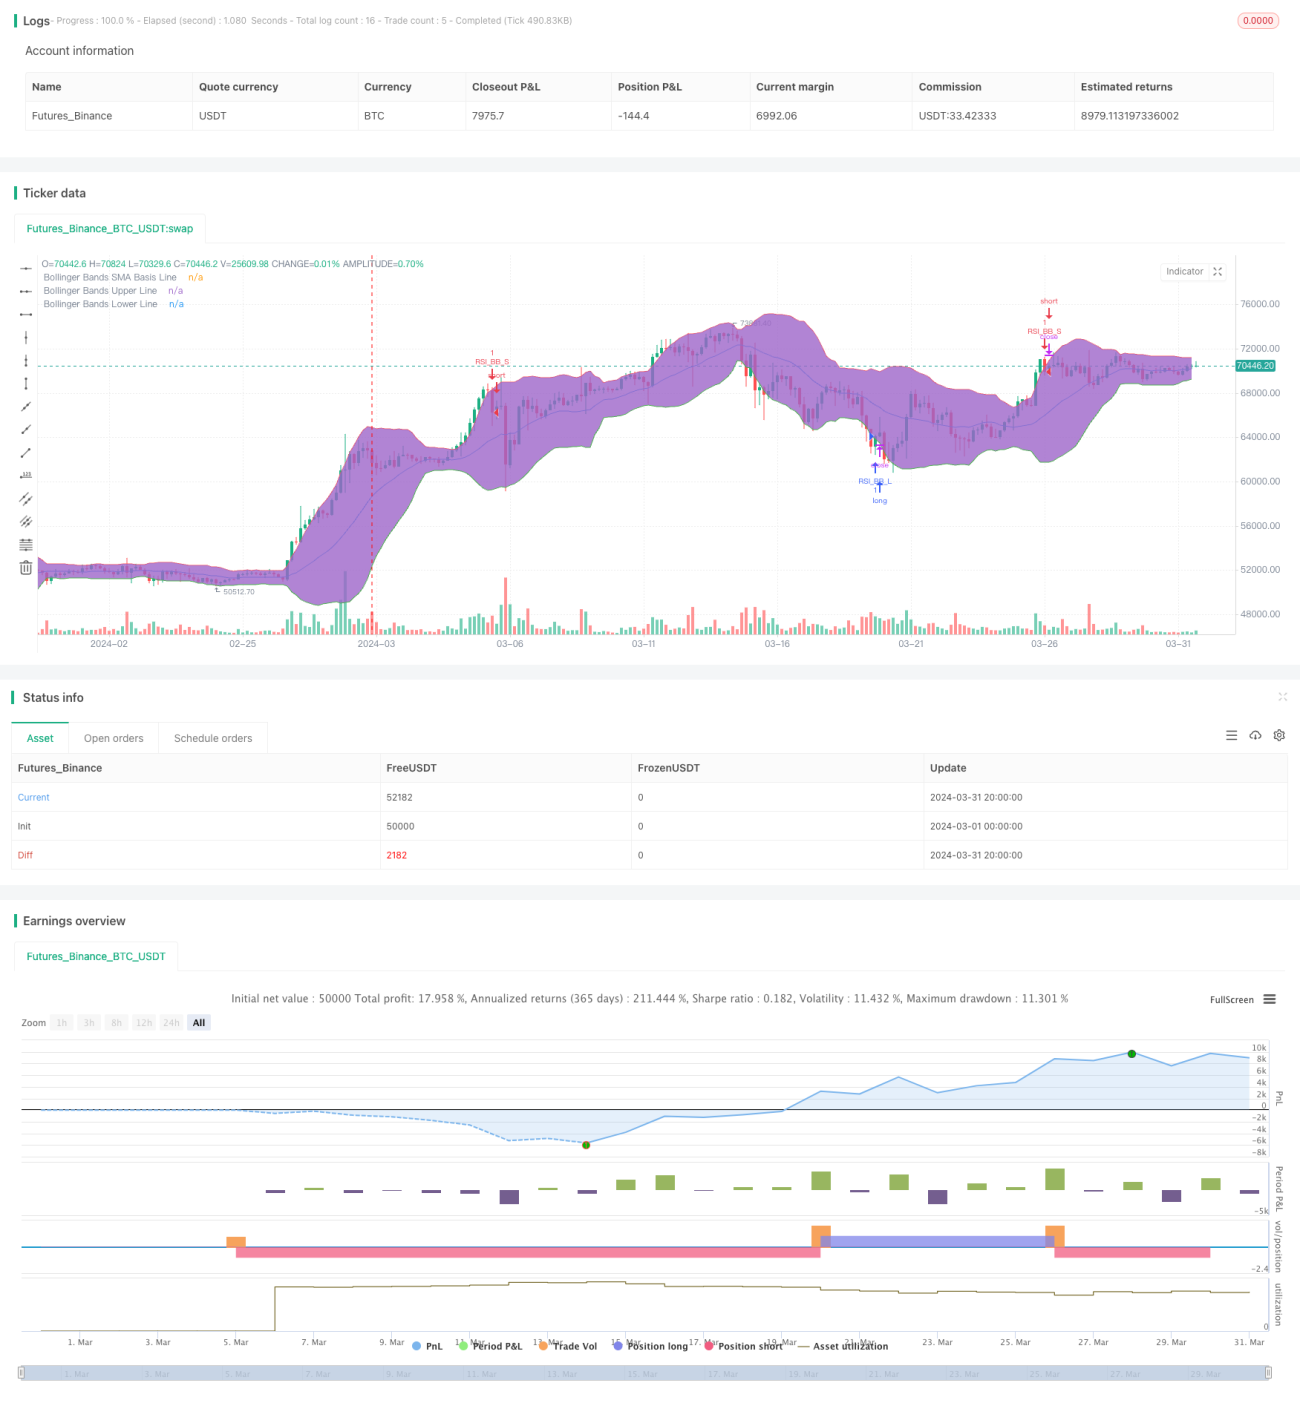
この戦略は,相対的に強い指数 ((RSI)) とブルリン帯 ((Bollinger Bands)) の2つの技術指標を組み合わせて,価格がブルリン帯を下回るときに買い信号を生じ,価格がブルリン帯上回るときに売り信号を生じさせる.この戦略は,RSI指標とブルリン帯指標が同時に超売りまたは超買い状態にある場合にのみ取引信号を誘発する.

戦略原則

  1. RSI値を設定した RSIパラメータから計算する.
  2. ブリン帯公式を用いてブリン帯中線,上線,下線を計算する.
  3. ブルイン帯を突破したかどうか判断する.
  4. 現在のRSI値が超買値より高いか,超売値より低いかを判断する.
  5. ブリン帯とRSIが同時に買入または売却条件を満たすとき,相応の取引シグナルが生成されます.

戦略的優位性

  1. 市場状況についてより全面的に判断できるように,トレンドとモチベーションの2つの技術指標を組み合わせます.
  2. フィルタリング条件として2つの指標を同時に使用することで,偽信号の発生確率を効果的に低下させました.
  3. 明確なコードロジック,パラメータ設定の柔軟性により,異なる市場環境と取引スタイルに適しています.

戦略リスク

  1. この戦略は,不安定な市場では,より多くの損失を招く可能性があります.
  2. パラメータの設定が不適切である場合,戦略の不良なパフォーマンスを引き起こす可能性があり,実際の状況に応じて最適化する必要があります.
  3. この戦略は,ストップ・ロスを設定していないため,撤回のリスクが大きい可能性があります.

戦略最適化の方向性

  1. RSIとブリン帯のパラメータは,市場特性と個人の好みに応じて最適化できます.
  2. MACD,平均線などの他の技術指標を導入し,信号の信頼性を向上させる.
  3. 合理的なストップとストップを設定し,単一取引のリスクをコントロールする.
  4. 振動性のある市場では,判断条件を高め,またはポジションを小さくし,頻繁に取引するコストを削減することを考えることができます.

要約する

RSIとブリン帯の二重戦略は,傾向と動力の指標を組み合わせて,市場状態を比較的に全体的に判断し,それに応じた取引信号を与える.しかし,この戦略は,振動的な市場では不良なパフォーマンスを発揮し,リスク制御措置が設定されていないため,現場での使用は慎重にする必要があります.パラメータを最適化し,他の指標を導入し,合理的なストップ・ロスを設定するなどの方法で,この戦略の安定性と収益性をさらに向上させることができます.

ストラテジーソースコード
/*backtest
start: 2024-03-01 00:00:00
end: 2024-03-31 23:59:59
period: 4h
basePeriod: 15m
exchanges: [{"eid":"Futures_Binance","currency":"BTC_USDT"}]
*/

//@version=4
strategy("Bollinger + RSI, Double Strategy (by ChartArt) v1.1", shorttitle="CA_-_RSI_Bol_Strat_1.1", overlay=true)

// ChartArt's RSI + Bollinger Bands, Double Strategy - Update
//
// Version 1.1
// Idea by ChartArt on January 18, 2015.
//
// This strategy uses the RSI indicator 
// together with the Bollinger Bands 
// to sell when the price is above the
// upper Bollinger Band (and to buy when
// this value is below the lower band).
//
// This simple strategy only triggers when
// both the RSI and the Bollinger Bands
// indicators are at the same time in
// a overbought or oversold condition.
//
// In this version 1.1 the strategy was
// both simplified for the user and
// made more successful in backtesting. 
//
// List of my work: 
// https://www.tradingview.com/u/ChartArt/
// 
//  __             __  ___       __  ___ 
// /  ` |__|  /\  |__)  |   /\  |__)  |  
// \__, |  | /~~\ |  \  |  /~~\ |  \  |  
// 
// 

///////////// RSI
RSIlength = input(14,title="RSI Period Length") 
RSIoverSold = 30
RSIoverBought = 70
price = close
vrsi = rsi(price, RSIlength)


///////////// Bollinger Bands
BBlength = input(20, minval=1,title="Bollinger Period Length")
BBmult = input(2.0, minval=0.001, maxval=50,title="Bollinger Bands Standard Deviation")
BBbasis = sma(price, BBlength)
BBdev = BBmult * stdev(price, BBlength)
BBupper = BBbasis + BBdev
BBlower = BBbasis - BBdev
source = close
buyEntry = crossover(source, BBlower)
sellEntry = crossunder(source, BBupper)
plot(BBbasis, color=color.blue,title="Bollinger Bands SMA Basis Line")
p1 = plot(BBupper, color=color.red,title="Bollinger Bands Upper Line")
p2 = plot(BBlower, color=color.green,title="Bollinger Bands Lower Line")
fill(p1, p2)

// Entry conditions
crossover_rsi = crossover(vrsi, RSIoverSold) and crossover(source, BBlower)
crossunder_rsi = crossunder(vrsi, RSIoverBought) and crossunder(source, BBupper)

///////////// RSI + Bollinger Bands Strategy
if (not na(vrsi))
    if (crossover_rsi)
        strategy.entry("RSI_BB_L", strategy.long, comment="RSI_BB_L")
    else
        strategy.cancel(id="RSI_BB_L")
        
    if (crossunder_rsi)
        strategy.entry("RSI_BB_S", strategy.short, comment="RSI_BB_S")
    else
        strategy.cancel(id="RSI_BB_S")