동적 돌파 이동 평균 거래 전략

개요
이 전략의 주요 아이디어는 다양한 주기의 Ratio OCHL Averager 지표를 사용하여 여러 개의 평균선을 구성하고, 평균선의 교차 모양에 따라 매매 신호를 생성하는 것입니다. 그것은 가격 추세를 동적으로 포착하여 중장기 거래에 적합합니다.
전략 원칙
이 전략은 두 개의 다른 주기 Ratio OCHL Averager 지표를 사용하여, 각각 빠른 라인 및 느린 라인 <unk> Ratio OCHL Averager 지표의 계산 공식은 다음과 같습니다:
pine
b = abs(close-open)/(high - low)
c = min(max(b, 0), 1)
Ratio OCHL Averager = c*close + (1-c)*前一日Ratio OCHL Averager
여기서 b는 당일 가격 변동 상황을 나타내는 비율이며, c는 b에 대한 표준화 처리 후의 값이다. Ratio OCHL Averager 지표는 오픈 가격, 클로즈 가격, 최고 가격 및 최저 가격의 네 가지 가격을 통합하여 평균선을 구성한다.
이 전략은 빠른 선의 주기가 짧고, 느린 선의 주기가 길다. 빠른 선에서 느린 선을 통과하면 구매 신호가 발생하고, 반대로 빠른 선 아래의 느린 선을 통과하면 판매 신호가 발생한다. 평선 교차 원리를 사용하여 트렌드를 잡는다.
전략적 이점
-
Ratio OCHL Averager 지표는 가격 데이터를 부드럽게 하고, 시장 소음을 효과적으로 필터링하여 거래 신호를 더 신뢰할 수 있게 한다.
-
쌍평선 교차는 다른 주기와 결합하여 트렌드 방향을 판단하여 새로운 트렌드의 시작을 더 잘 판단할 수 있다.
-
빠른 선과 느린 선의 주기 변수를 조정하여 다양한 시장 환경에 적응할 수 있다.
-
전략은 간단하고 직관적이며, 실행에 옮기기 쉽다.
-
손해 차단 기준을 유연하게 설정하여 위험을 제어할 수 있습니다.
전략적 위험
-
평선 교차 전략은 더 많은 가짜 신호를 생성할 수 있으며, 다른 기술 지표와 함께 필터링이 필요합니다.
-
빠른 선과 느린 선의 주기적 변수를 합리적으로 선택해야 하며, 변수 선택이 잘못되면 전략 효과에 영향을 줄 수 있다.
-
양평선 교차 전략은 트렌드 추적 전략에 속하며, 동요행동에 적합하지 않으며, 트렌드행동에 사용되어야 한다.
-
손실 위험을 줄이기 위해 스톱포트를 적절하게 조정해야 하며, 스톱포트는 합리적으로 설정되어야 한다.
최적화 방향
-
동력 지표와 같은 조합으로 신호 필터링을 고려할 수 있으며, 신호 품질을 향상시킬 수 있다. 예를 들어 MACD, KDJ 등이다.
-
다양한 패스트라인과 패스트라인 주기 파라미터 조합을 테스트하여 최적의 파라미터를 찾을 수 있다.
-
피드백 결과에 따라 최적의 스톱포인트를 최적화하여 최적의 설정을 찾을 수 있다.
-
특정 시장 환경에서 동적으로 조정되는 파라미터를 고려할 수 있습니다. 예를 들어, 대시장 흔들림 때 확대되는 주기적 파라미터 <unk>.
요약하다
이 전략의 전체적인 아이디어는 명확하고 이해하기 쉽다. 급속한 평평선 교차를 통해 트렌드 방향을 판단한다. 중·단기 거래에 적합한 동적 추적 전략이다. 최적화 공간이 넓고, 매개 변수 조정, 신호 필터링 등의 방법으로 전략 효과를 더욱 향상시킬 수 있다.
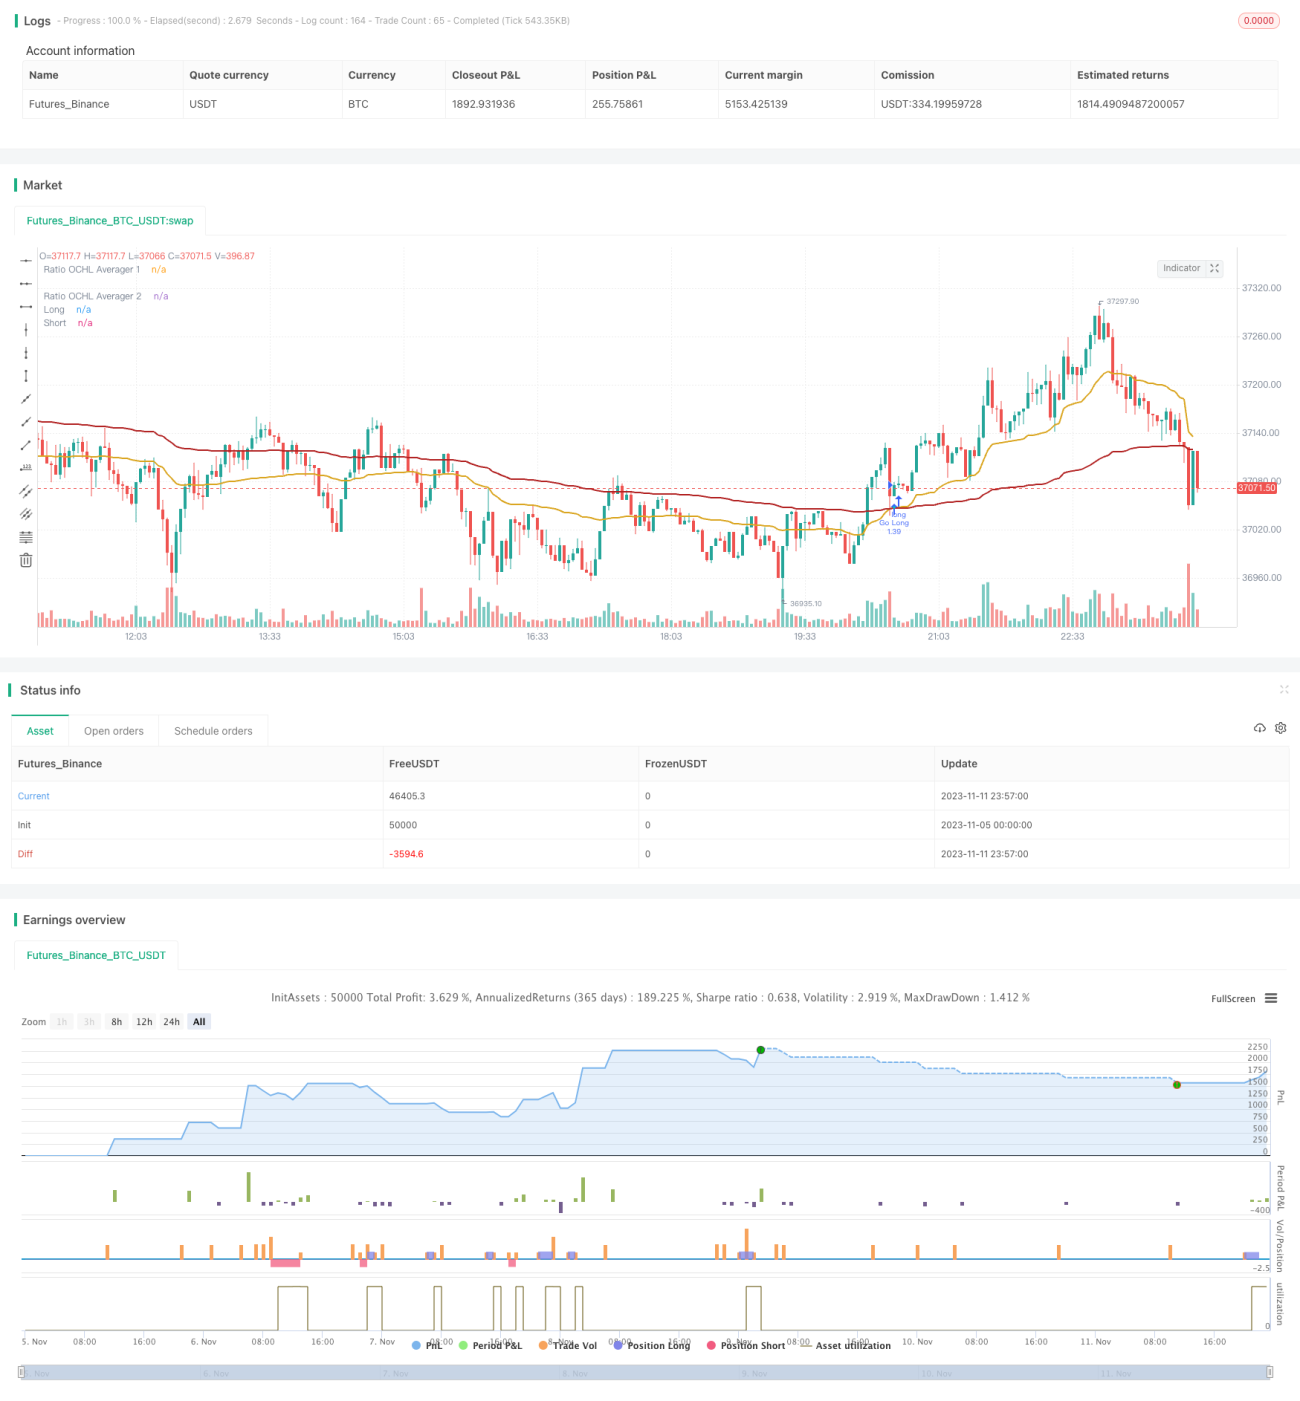
/*backtest
start: 2023-11-05 00:00:00
end: 2023-11-12 00:00:00
period: 3m
basePeriod: 1m
exchanges: [{"eid":"Futures_Binance","currency":"BTC_USDT"}]
*/

//@version=4
strategy(title="[XC] Adaptive Strategy V3 - Ratio OCHL Averager no repaint",shorttitle="R_OHCL", overlay=true, currency=currency.EUR,initial_capital=10000,
     default_qty_value=100, default_qty_type=strategy.percent_of_equity , calc_on_every_tick=false, calc_on_order_fills=true)
- 1