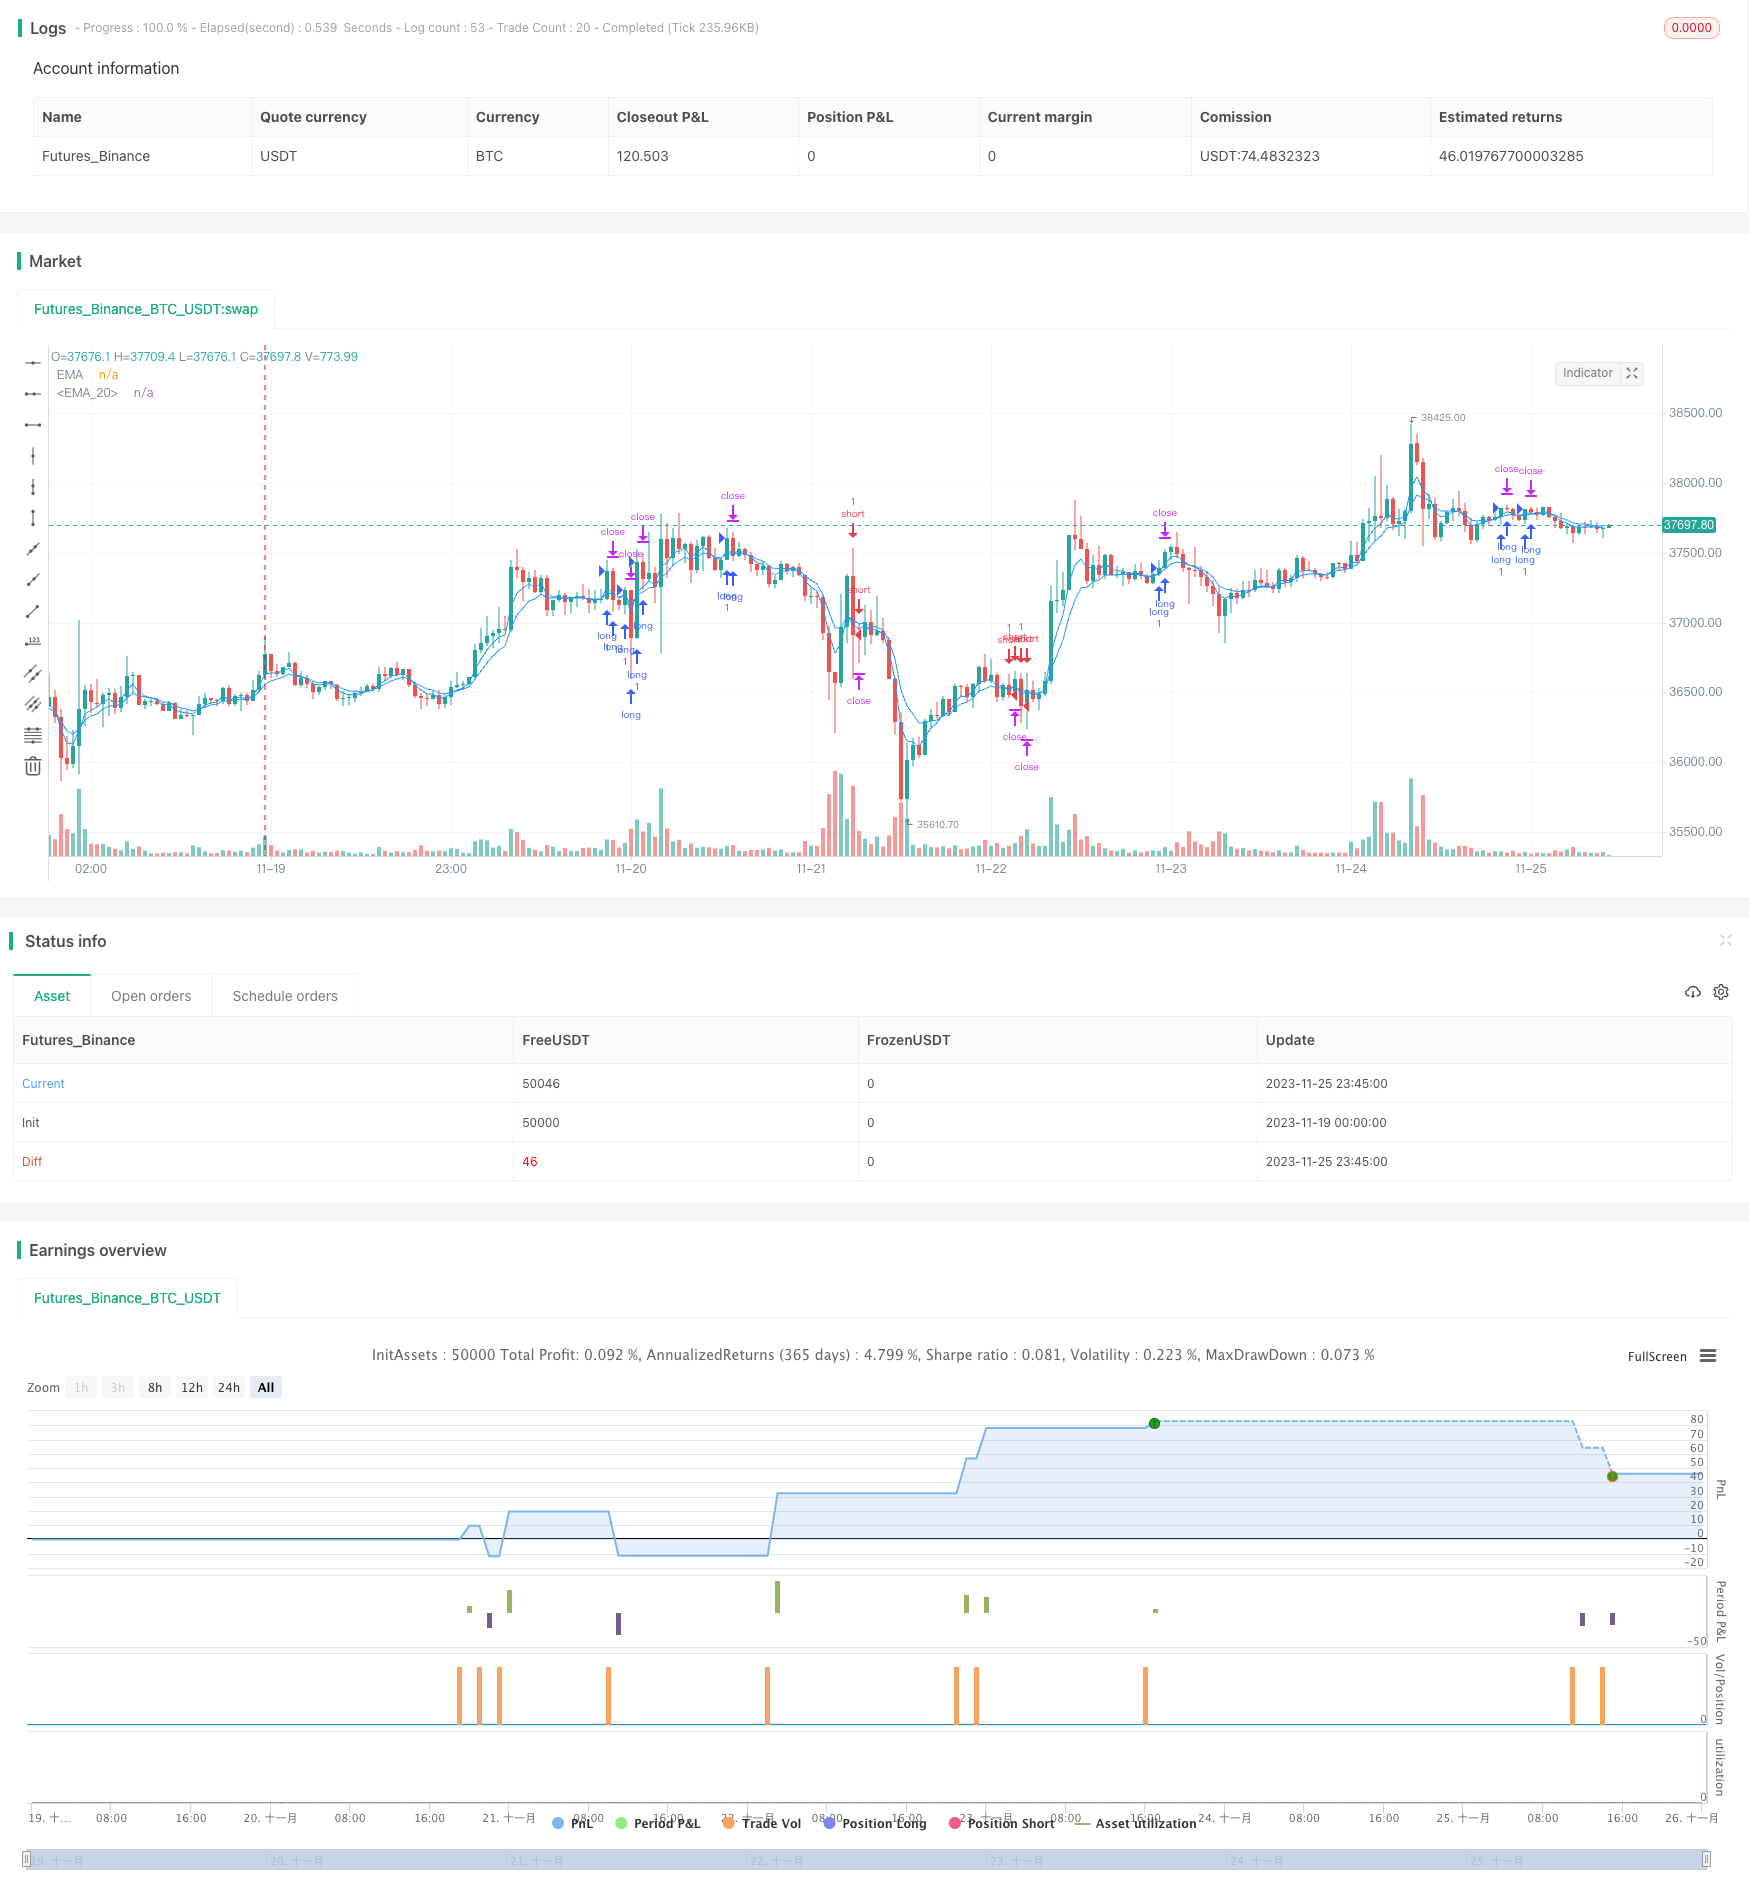
개요
이 전략은 이동 평균 EMA, 상대적으로 강한 지표 RSI, 상품 채널 지표 CCI 세 가지 주요 지표를 결합하여 EMA 평균을 통해 가격 추세를 회전하는지 확인하고, RSI와 CCI 지표를 사용하여 거래 신호를 형성합니다. 중기 거래 전략에 속합니다.
전략 원칙
4주기 및 8주기 EMA의 평균선을 교차하여 가격 추세를 판단하고, 4주기 빠른 판단과 8주기 느린 결정;
EMA 평균선이 상향으로 회전할 때, 즉 4주기선에 8주기선을 뚫고, RSI 지표가 65보다 높다는 것을 보조하고 (상대적인 오버 바이 지역) CCI 지표가 0보다 높다는 것을 보조하고 (상대적인 오버 바이가 없는 것을 의미한다) 만족하면 더 많은 신호를 생성합니다.
EMA 평균선이 하향으로 회전할 때, 즉 4주기선 아래 8주기선을 뚫고, RSI 지표가 35보다 낮다는 것을 판단하고 (상대적인 초상조) CCI 지표가 0보다 낮다는 것을 판단하고 (상대적인 초상조가 없다는 것을 나타냅니다), 만족하면 공백 신호를 생성합니다.
신호가 형성된 후, 입력된 스톱피스 거리 및 스톱피스 거리에 따라 스톱피스 및 스톱피스 가격을 설정한다.
전체적으로, 이 전략은 중장기 가격 추세와 단기 지표가 오버 바이 오버 셀 영역을 회피하는 것을 고려하여 비교적 안정적이며, 또한 스톱 로즈 스 설정은 단일 거래의 최대 손실을 효과적으로 제어한다.
우위 분석
다중 지표 통합 판단을 통해, 실수할 확률이 높은 단일 지표 거래 전략을 피합니다.
EMA는 주류를 판단하여 단기 변동에 의해 오해되는 것을 피합니다. RSI와 CCI 지표는 오버 바이 오버 셀 영역을 피하여 승률을 높입니다.
자동으로 단편 거래 위험을 제어하는 스톱로스 및 스톱스톱을 설정하여 극한 상황으로 인한 손실이 확대되는 것을 효과적으로 방지합니다.
이 전략은 기술적인 거래 전략이며, 기본적 영향을 받지 않으며, 시장의 어떤 단위 주기에도 사용할 수 있으며, 실장에 쉽게 사용할 수 있다.
위험 분석
기술 지표는 급격한 이익/기쁜 소식이 있을 때 무효가 될 수 있습니다.
주가가 급격하게 변동할 때, 스톱더는 깨질 수 있으며, 스톱더는 적절히 완화되어야 합니다.
이 전략은 단선 빈도 거래 전략에 속하며, 거래 비용이 수익에 영향을 미치며, 비용 우위를 가진 고주파 전략에 적합하다.
최적화 방향
기계 학습 알고리즘을 추가하여 주식 기본 조건에 따라 변수를 자동으로 조정합니다.
고정된 스포드 거리 대신 적응형 스포드 메커니즘을 추가한다.
요약하다
이 거래 전략은 여러 지표 판단을 통합하고, 합리적인 매개 변수 설정을 하면, 비교적 안정적인 중·단기 거래 수익을 얻을 수 있으며, 실장에 쉬운 기술적인 측면 전략에 속한다. 그러나 동시에 갑작스러운 중요한 기본 뉴스를 방지하고, 적절히 느슨한 손해 차단 거리 등의 위험 예방 조치를 주의해야 하며, 이는 향후 더 최적화 할 수 있는 방향이기도 하다.
/*backtest
start: 2023-11-19 00:00:00
end: 2023-11-26 00:00:00
period: 45m
basePeriod: 5m
exchanges: [{"eid":"Futures_Binance","currency":"BTC_USDT"}]
*/

// This source code is subject to the terms of the Mozilla Public License 2.0 at https://mozilla.org/MPL/2.0/
// © SoftKill21

//@version=4


strategy(title="Moving Average Exponential", shorttitle="EMA", overlay=true)


len4 = input(4, minval=1, title="Length_MA4")
src4 = input(close, title="Source")
offset4 = input(title="Offset", type=input.integer, defval=0, minval=-500, maxval=500)
out4 = ema(src4, len4)
plot(out4, title="EMA", color=color.blue, offset=offset4)

len8 = input(8, minval=1, title="Length_MA8")
src8 = input(close, title="Source")
offset8 = input(title="Offset", type=input.integer, defval=0, minval=-500, maxval=500)
out8 = ema(src8, len8)
plot(out8, title="EMA", color=color.blue, offset=offset8)


//rsioma
src = close, len = input(14, minval=1, title="Length")
up = rma(max(change(ema(src, len)), 0), len)
down = rma(-min(change(ema(src, len)), 0), len)
rsi = down == 0 ? 100 : up == 0 ? 0 : 100 - (100 / (1 + up / down))
//plot(rsi, color=color.blue)
//band1 = hline(80)
//band0 = hline(20)
//fill(band1, band0, color=color.purple, transp=90)
//hline(50, color=color.gray, linestyle=plot.style_line)
sig = ema(rsi, 21)
//plot(sig, color=color.purple)

//woodie
cciTurboLength = input(title="CCI Turbo Length", type=input.integer, defval=6, minval=3, maxval=14)
cci14Length = input(title="CCI 14 Length", type=input.integer, defval=14, minval=7, maxval=20)

source = close

cciTurbo = cci(source, cciTurboLength)
cci14 = cci(source, cci14Length)

last5IsDown = cci14[5] < 0 and cci14[4] < 0 and cci14[3] < 0 and cci14[2] < 0 and cci14[1] < 0
last5IsUp = cci14[5] > 0 and cci14[4] > 0 and cci14[3] > 0 and cci14[2] > 0 and cci14[1] > 0
histogramColor = last5IsUp ? color.green : last5IsDown ? color.red : cci14 < 0 ? color.green : color.red


// Exit Condition
// Exit Condition
a = input(12)*10
b = input(15)*10
c = a*syminfo.mintick
d = b*syminfo.mintick


longCondition = crossover(out4, out8) and (rsi >= 65 and cci14>=0)
shortCondition = crossunder(out4, out8) and (rsi <=35 and cci14<=0)


long_stop_level     = float(na)
long_profit_level1  = float(na)
long_profit_level2  = float(na)
long_even_level     = float(na)

short_stop_level    = float(na)
short_profit_level1 = float(na)
short_profit_level2 = float(na)
short_even_level    = float(na)

long_stop_level     := longCondition  ? close - c : long_stop_level     [1]
long_profit_level1  := longCondition  ? close + d : long_profit_level1  [1]
//long_profit_level2  := longCondition  ? close + d : long_profit_level2  [1]
//long_even_level     := longCondition  ? close + 0 : long_even_level     [1]

short_stop_level    := shortCondition ? close + c : short_stop_level    [1]
short_profit_level1 := shortCondition ? close - d : short_profit_level1 [1]
//short_profit_level2 := shortCondition ? close - d : short_profit_level2 [1]
//short_even_level    := shortCondition ? close + 0 : short_even_level    [1]


//ha
// === Input ===
//ma1_len = input(1, title="MA 01")
//ma2_len = input(40, title="MA 02")

// === MA 01 Filter ===
//o=ema(open,ma1_len)
//cc=ema(close,ma1_len)
//h=ema(high,ma1_len)
//l=ema(low,ma1_len)

// === HA calculator ===
//ha_t = heikinashi(syminfo.tickerid)
//ha_o = security(ha_t, timeframe.period, o)
//ha_c = security(ha_t, timeframe.period, cc)
//ha_h = security(ha_t, timeframe.period, h)
//ha_l = security(ha_t, timeframe.period, l)

// === MA 02 Filter ===
//o2=ema(ha_o, ma2_len)
//c2=ema(ha_c, ma2_len)
//h2=ema(ha_h, ma2_len)
//l2=ema(ha_l, ma2_len)

// === Color def ===
//ha_col=o2>c2 ? color.red : color.lime

// ===  PLOTITING===
//plotcandle(o2, h2, l2, c2, title="HA Smoothed", color=ha_col)

tp=input(120)
sl=input(96)

strategy.entry("long", strategy.long, when = longCondition)
//strategy.close("long", when = o2>c2 , comment="ha_long")
strategy.entry("short", strategy.short , when =shortCondition )
//strategy.close("short", when = o2<=c2 , comment = "ha_short" )

//strategy.close("long",when=long_profit_level1 or long_stop_level  , comment="tp/sl")
//strategy.close("short",when=short_profit_level1 or short_stop_level , comment="tp/sl")

strategy.exit("x_long","long",profit = tp, loss = sl) //when = o2>c2)
strategy.exit("x_short","short",profit = tp, loss = sl) //when = o2<c2)