
이중 궤도 돌파 평행선 교차 전략은 트렌드 추적 타입의 양적 거래 전략이다. 이 전략은 이중 궤도 메커니즘을 사용하여 시장의 트렌드 방향을 판단하고 평행선 교차 신호와 함께 진출한다. 구체적으로, 이 전략은 다른 주기의 평균을 사용하여 이중 궤도를 구축하고, 가격 돌파를 상행선 또는 하행선으로 판단한다. 그리고는 빠른 느린 평행선 교차 신호와 결합하여 진입 시기를 필터링한다.
쌍레일 돌파평선 교차 전략은 주로 다음과 같은 부분들로 구성된다:
트렌드 판단 모듈: 서로 다른 주기 평균선을 사용하여 두 개의 궤도를 구성합니다. 가격 돌파는 상승 추세로 판단되며, 하향 궤도를 돌파하는 것은 하향 추세로 판단됩니다.
입학 모듈: 급속한 평행선에서 중간 긴 평행선을 통과할 때 더 많이 하고, 아래로 이동할 때 공백을 한다. 동시에 트렌드 방향을 판단할 필요가 있다.
출장 모듈: 빠른 평균선 아래로 중장선 평균선을 통과할 때 평지한다.
전략은 먼저 Trend Required 파라미터를 사용하여 판단할 필요가 있는 트렌드 강도를 설정한다. 가격이 상회 또는 하향 궤도를 돌파할 때, 추세로 판단한다. 그 후, 빠른 평균선에서 중장기 평균선을 통과할 때, 더 많은 입장을 한다. 빠른 평균선 아래 중장기 평균선을 통과할 때, 공백 입장을 한다. 입장을 한 후, 빠른 평균선 아래 중장기 평균선을 통과하는 것은 출발 신호이다.
또한, 전략은 중단, 중지 모듈을 갖추고 있다. 특정 매개 변수는 조정 및 최적화 할 수 있으며, 위험과 수익을 제어 할 수 있다.
단일 레일 또는 단일 평평선 전략에 비해, 쌍레일 돌파 평평선 교차 전략은 트렌드 판단과 진입 시기를 선택하여 시장의 속도를 더 잘 파악할 수 있습니다. 구체적인 장점은 다음과 같습니다:
이중 레일 설정은 트렌드를 더 정확하게 판단하여 기회를 놓치지 않도록 합니다.
평선 교차 필터는 가짜 돌파구가 역방향으로 작동할 확률을 줄일 수 있다.
매개 변수를 조정하여 위험과 수익을 최적화 할 수 있습니다.
전략적 논리는 간단하고 명확하며, 이해하기 쉽고, 추적하기 쉽습니다.
이중 레일을 뚫고 평행선 교차하는 전략에도 위험성이 존재합니다.
이중 궤도 설정은 트렌드 판단 오류의 가능성을 완전히 피할 수 없습니다.
평균선 파라미터를 잘못 설정하면 거래 빈도가 너무 높거나 역으로 작동할 수 있다.
단편 손실을 효과적으로 제어할 수 없는 너무 느슨한 스톱포인트 설정.
대응방법은 다음과 같습니다.
이중 궤도 파라미터를 조정하고, 돌파 판단 범위를 적절히 완화한다.
거래 빈도가 합리적인지 확인하기 위해 평형 주기 포트폴리오를 최적화하십시오.
다양한 스톱포인트 레벨을 테스트하여 최적의 파라미터를 찾습니다.
이중 레일 횡단 평행선 교차 전략에는 다음과 같은 몇 가지 최적화 방향이 있습니다.
다양한 평행 주기 변수를 테스트하여 최적의 조합을 찾습니다.
더 많은 균등선을 추가하고, 더 많은 균등선을 필터링하는 시스템을 구축하는 것을 시도하십시오.
추적 손실, 진동 손실 등 다양한 손실 방지 알고리즘을 테스트합니다.
이윤회복기구에 가입하여 자금의 효율성을 최적화한다.
다른 지표와 함께 필터링합니다. 예를 들어, 브린 테이프, KDJ 등.
쌍레일 돌파평선 교차 전략 종합은 트렌드 판단과 진입 시점 선택을 고려하여 시장의 속도를 효과적으로 파악할 수 있습니다. 단일 지표에 비해 이 전략은 판단과 필터링이 더 정확하다는 특징을 가지고 있습니다. 매개 변수 최적화 및 모듈 업그레이드를 통해 전략의 안정성과 수익률을 더욱 향상시킬 수 있습니다.
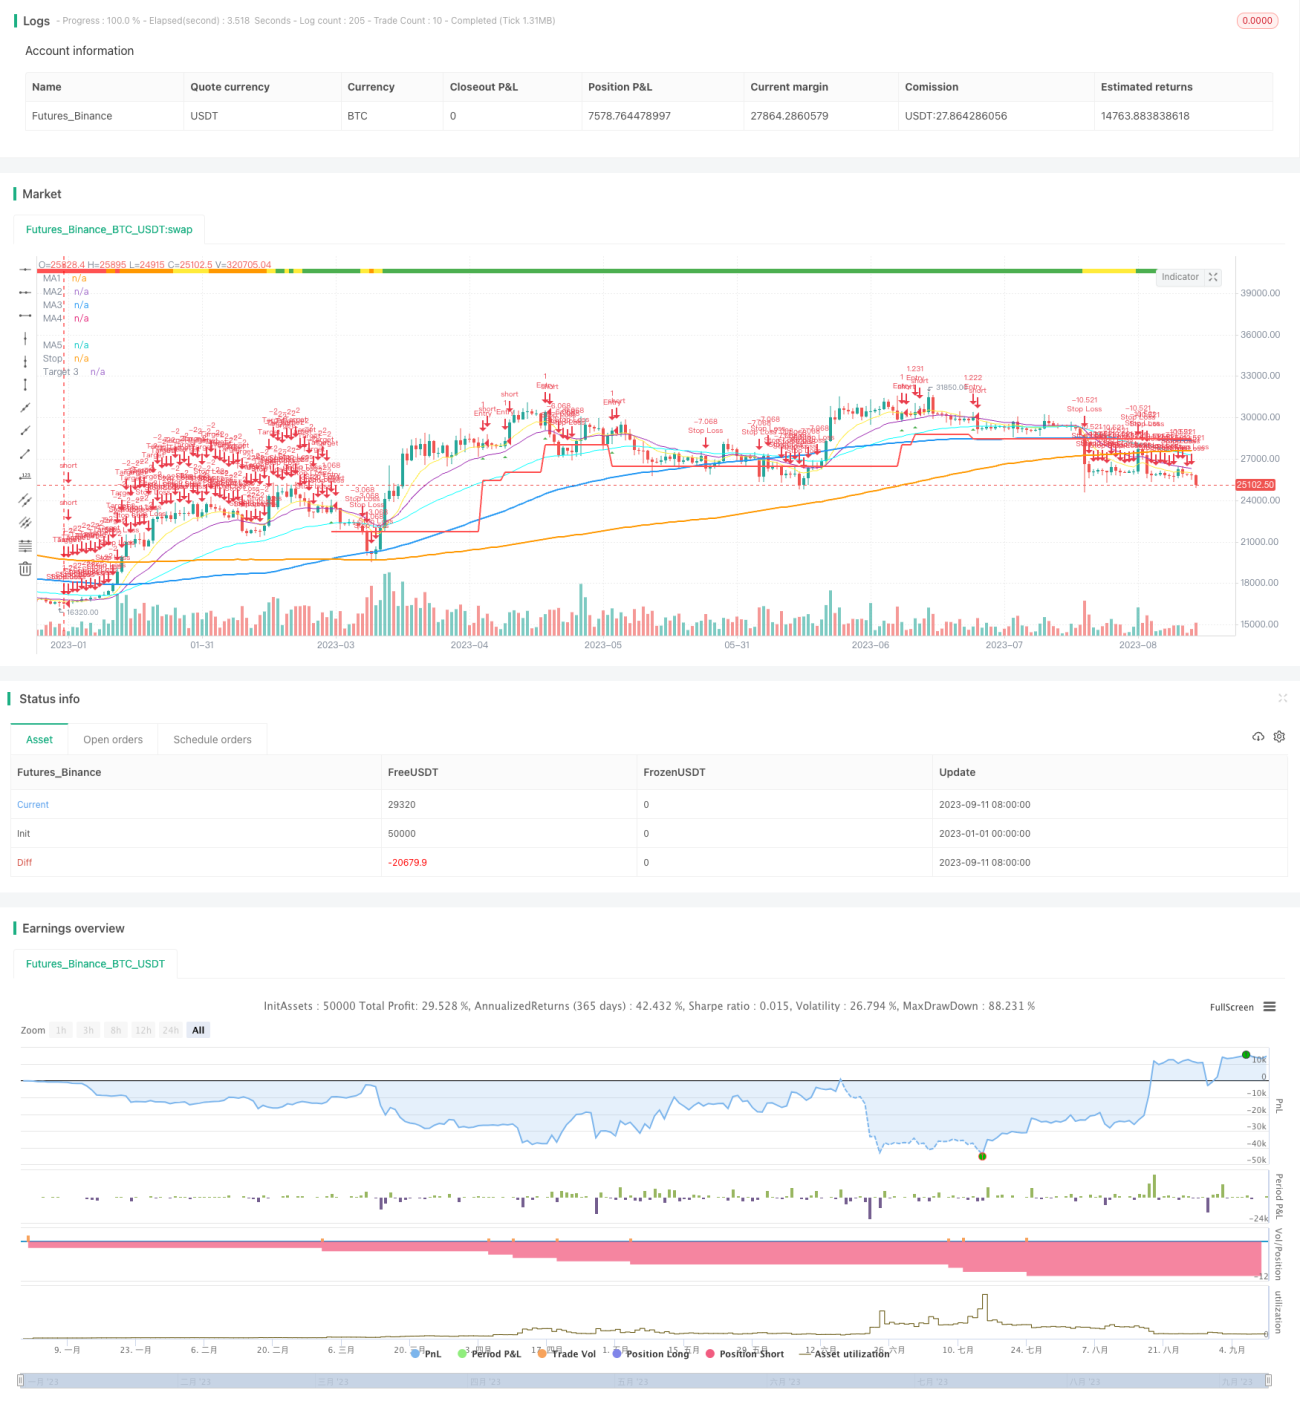
/*backtest
start: 2023-01-01 00:00:00
end: 2023-09-12 00:00:00
period: 1d
basePeriod: 1h
exchanges: [{"eid":"Futures_Binance","currency":"BTC_USDT"}]
*/
//@version=4
//Author = Dustin Drummond https://www.tradingview.com/u/Dustin_D_RLT/
//Strategy based in part on original 10ema Basic Swing Trade Strategy by Matt Delong: https://www.tradingview.com/u/MattDeLong/
//Link to original 10ema Basic Swing Trade Strategy: https://www.tradingview.com/script/8yhGnGCM-10ema-Basic-Swing-Trade-Strategy/
//This is the Original EMAC - Exponential Moving Average Cross Strategy built as a class for reallifetrading dot com and so has all the default settings and has not been optimized
//I would not recomend using this strategy with the default settings and is for educational purposes only
//For the fully optimized version please come back around the same time tomorrow 6/16/21 for the EMAC - Exponential Moving Average Cross - Optimized
//EMAC - Exponential Moving Average Cross
strategy(title="EMAC - Exponential Moving Average Cross", shorttitle = "EMAC", overlay = true, calc_on_every_tick=false, default_qty_value = 100, initial_capital = 100000, default_qty_type = strategy.fixed, pyramiding = 0, process_orders_on_close=true)
//creates a time filter to prevent "too many orders error" and allows user to see Strategy results per year by changing input in settings in Stratey Tester
startYear = input(2015, title="Start Year", minval=1980, step=1)
timeFilter = (year >= startYear) and (month >= 1) and (dayofmonth >= 1)
//R Size (Risk Amount)
rStaticOrPercent = input(title="R Static or Percent", defval="Static", options=["Static", "Percent"])
rSizeStatic = input(2000, title="R Size Static", minval=1, step=100)
rSizePercent = input(3, title="R Size Percent", minval=.01, step=.01)
rSize = rStaticOrPercent == "Static" ? rSizeStatic : rStaticOrPercent == "Percent" ? (rSizePercent * .01 * strategy.equity) : 1
//Recent Trend Indicator "See the standalone version for detailed description"
res = input(title="Trend Timeframe", type=input.resolution, defval="W")
trend = input(26, minval=1, title="# of Bars for Trend")
trendMult = input(15, minval=0, title="Trend Growth %", step=.25) / 100
currentClose = security(syminfo.tickerid, res, close)
pastClose = security(syminfo.tickerid, res, close[trend])
//Trend Indicator
upTrend = (currentClose >= (pastClose * (1 + trendMult)))
downTrend = (currentClose <= (pastClose * (1 - trendMult)))
sidewaysUpTrend = (currentClose < (pastClose * (1 + trendMult)) and (currentClose > pastClose))
sidewaysDownTrend = (currentClose > (pastClose * (1 - trendMult)) and (currentClose < pastClose))
//Plot Trend on Chart
plotshape(upTrend, "Up Trend", style=shape.square, location=location.top, color=color.green, size=size.small)
plotshape(downTrend, "Down Trend", style=shape.square, location=location.top, color=color.red, size=size.small)
plotshape(sidewaysUpTrend, "Sideways Up Trend", style=shape.square, location=location.top, color=color.yellow, size=size.small)
plotshape(sidewaysDownTrend, "Sideways Down Trend", style=shape.square, location=location.top, color=color.orange, size=size.small)
//What trend signals to use in entrySignal
trendRequired = input(title="Trend Required", defval="Orange", options=["Green", "Yellow", "Orange", "Red"])
goTrend = trendRequired == "Orange" ? upTrend or sidewaysUpTrend or sidewaysDownTrend : trendRequired == "Yellow" ? upTrend or sidewaysUpTrend : trendRequired == "Green" ? upTrend : trendRequired == "Red" ? upTrend or sidewaysUpTrend or sidewaysDownTrend or downTrend : na
//MAs Inputs Defalt is 10 EMA, 20 EMA, 50 EMA, 100 SMA and 200 SMA
ma1Length = input(10, title="MA1 Period", minval=1, step=1)
ma1Type = input(title="MA1 Type", defval="EMA", options=["SMA", "EMA", "WMA"])
ma2Length = input(20, title="MA2 Period", minval=1, step=1)
ma2Type = input(title="MA2 Type", defval="EMA", options=["SMA", "EMA", "WMA"])
ma3Length = input(50, title="MA3 Period", minval=1, step=1)
ma3Type = input(title="MA3 Type", defval="EMA", options=["SMA", "EMA", "WMA"])
ma4Length = input(100, title="MA4 Period", minval=1, step=1)
ma4Type = input(title="MA4 Type", defval="SMA", options=["SMA", "EMA", "WMA"])
ma5Length = input(200, title="MA5 Period", minval=1, step=1)
ma5Type = input(title="MA5 Type", defval="SMA", options=["SMA", "EMA", "WMA"])
//MAs defined
ma1 = ma1Type == "EMA" ? ema(close, ma1Length) : ma1Type == "SMA" ? sma(close, ma1Length) : wma(close, ma1Length)
ma2 = ma2Type == "EMA" ? ema(close, ma2Length) : ma2Type == "SMA" ? sma(close, ma2Length) : wma(close, ma2Length)
ma3 = ma3Type == "EMA" ? ema(close, ma3Length) : ma3Type == "SMA" ? sma(close, ma3Length) : wma(close, ma3Length)
ma4 = ma4Type == "SMA" ? sma(close, ma4Length) : ma4Type == "EMA" ? ema(close, ma4Length) : wma(close, ma4Length)
ma5 = ma5Type == "SMA" ? sma(close, ma5Length) : ma5Type == "EMA" ? ema(close, ma5Length) : wma(close, ma5Length)
//Plot MAs
plot(ma1, title="MA1", color=color.yellow, linewidth=1, style=plot.style_line)
plot(ma2, title="MA2", color=color.purple, linewidth=1, style=plot.style_line)
plot(ma3, title="MA3", color=#00FFFF, linewidth=1, style=plot.style_line)
plot(ma4, title="MA4", color=color.blue, linewidth=2, style=plot.style_line)
plot(ma5, title="MA5", color=color.orange, linewidth=2, style=plot.style_line)
//Allows user to toggle on/off ma1 > ma2 filter
enableShortMAs = input(title="Enable Short MA Cross Filter", defval="Yes", options=["Yes", "No"])
shortMACross = enableShortMAs == "Yes" and ma1 > ma2 or enableShortMAs == "No"
//Allows user to toggle on/off ma4 > ma5 filter
enableLongMAs = input(title="Enable Long MA Cross Filter", defval="Yes", options=["Yes", "No"])
longMACross = enableLongMAs == "Yes" and ma4 >= ma5 or enableLongMAs == "No"
//Entry Signals
entrySignal = (strategy.position_size <= 0 and close[1] < ma1[1] and close > ma1 and close > ma2 and close > ma3 and shortMACross and ma1 > ma3 and longMACross and goTrend)
secondSignal = (strategy.position_size > 0 and close[1] < ma1[1] and close > ma1 and close > ma2 and close > ma3 and shortMACross and ma1 > ma3 and longMACross and goTrend)
plotshape(entrySignal, style=shape.triangleup, location=location.belowbar, color=color.green, size=size.small)
plotshape(secondSignal, style=shape.triangleup, location=location.belowbar, color=color.lime, size=size.small)
//ATR for Stops
atrValue = (atr(14))
//to test ATR enable next line
//plot(atrValue, linewidth=1, color=color.black, style=plot.style_line)
atrMult = input(2.5, minval=.25, step=.25, title="Stop ATR Multiple")
//Only target3Mult is used in current strategy target1 and target2 might be used in the future with pyramiding
//target1Mult = input(1.0, minval=.25, step=.25, title="Targert 1 Multiple")
//target2Mult = input(2.0, minval=.25, step=.25, title="Targert 2 Multiple")
target3Mult = input(3.0, minval=.25, step=.25, title="Target Multiple")
enableAtrStop = input(title="Enable ATR Stops", defval="Yes", options=["Yes", "No"])
//Intitial Recomended Stop Location
atrStop = entrySignal and ((high - (atrMult * atrValue)) < low) ? (high - (atrMult * atrValue)) : low
//oneAtrStop is used for testing only enable next 2 lines to test
//oneAtrStop = entrySignal ? (high - atrValue) : na
//plot(oneAtrStop, "One ATR Stop", linewidth=2, color=color.orange, style=plot.style_linebr)
initialStop = entrySignal and enableAtrStop == "Yes" ? atrStop : entrySignal ? low : na
//Stops changed to stoploss to hold value for orders the next line is old code "bug"
//plot(initialStop, "Initial Stop", linewidth=2, color=color.red, style=plot.style_linebr)
//Set Initial Stop and hold value "debug code"
stoploss = valuewhen(entrySignal, initialStop, 0)
plot(stoploss, title="Stop", linewidth=2, color=color.red)
enableStops = input(title="Enable Stops", defval="Yes", options=["Yes", "No"])
yesStops = enableStops == "Yes" ? 1 : enableStops == "No" ? 0 : na
//Calculate size of trade based on R Size
//Original buggy code:
//positionSize = (rSize/(close - initialStop))
//Added a minimum order size of 1 "debug code"
positionSize = (rSize/(close - initialStop)) > 1 ? (rSize/(close - initialStop)) : 1
//Targets
//Enable or Disable Targets
enableTargets = input(title="Enable Targets", defval="Yes", options=["Yes", "No"])
yesTargets = enableTargets == "Yes" ? 1 : enableTargets == "No" ? 0 : na
//Only target3 is used in current strategy target1 and target2 might be used in the future with pyramiding
//target1 = entrySignal ? (close + ((close - initialStop) * target1Mult)) : na
//target2 = entrySignal ? (close + ((close - initialStop) * target2Mult)) : na
target3 = entrySignal ? (close + ((close - initialStop) * target3Mult)) : na
//plot(target1, "Target 1", linewidth=2, color=color.green, style=plot.style_linebr)
//plot(target2, "Target 2", linewidth=2, color=color.green, style=plot.style_linebr)
plot(target3, "Target 3", linewidth=2, color=color.green, style=plot.style_linebr)
//Set Target and hold value "debug code"
t3 = valuewhen(entrySignal, target3, 0)
//To test t3 and see plot enable next line
//plot(t3, title="Target", linewidth=2, color=color.green)
//MA1 Cross Exit
enableEarlyExit = input(title="Enable Early Exit", defval="Yes", options=["Yes", "No"])
earlyExit = enableEarlyExit == "Yes" ? 1 : enableEarlyExit == "No" ? 0 : na
ma1CrossExit = strategy.position_size > 0 and close < ma1
//Entry Order
strategy.order("Entry", long = true, qty = positionSize, when = (strategy.position_size <= 0 and entrySignal and timeFilter))
//Early Exit Order
strategy.close_all(when = ma1CrossExit and timeFilter and earlyExit, comment = "MA1 Cross Exit")
//Stop and Target Orders
//strategy.cancel orders are needed to prevent bug with Early Exit Order
strategy.order("Stop Loss", false, qty = strategy.position_size, stop=stoploss, oca_name="Exit",when = timeFilter and yesStops, comment = "Stop Loss")
strategy.cancel("Stop Loss", when = ma1CrossExit and timeFilter and earlyExit)
strategy.order("Target", false, qty = strategy.position_size, limit=t3, oca_name="Exit", when = timeFilter and yesTargets, comment = "Target")
strategy.cancel("Target", when = ma1CrossExit and timeFilter and earlyExit)