
이 전략은 지수 이동평균선의 방향을 판단하여 다공간 방향을 결정한다. 양선이 대대적으로 양선을 삼키는 형태가 나타나 거래량이 커지면 더 많은 작업을 수행한다. 지수 이동평균선의 방향이 전환되거나 대대적으로 양선이 양선을 삼키는 형태가 나타나면 평점 작업을 수행한다.
두 가지 다른 파라미터를 사용하여 지수 이동 평균선을 사용하여 시장의 경향 방향을 판단한다. 단기 EMA선은 장기 EMA선 위에 다단계 시장으로 간주되며, 반대로 공백 시장이다.
시장이 다목적 상태일 때, K선 전의 K선을 대체적으로 삼키고 거래량이 전의 K선보다 1.2배가 많으면, 더 많은 신호를 발생시킨다. 이 형태는 다목적 힘이 강하다는 것을 보여 주고, 더 많은 것을 따라 올릴 수 있다.
시장 추세가 전환되면, 즉 단기 EMA 아래에서 장기 EMA를 통과할 때, 다중의 힘이 약해지면 평지해야 한다. 또는 음선이 대대적으로 선선을 삼키는 형태가 나타날 때, 공중의 힘이 가중되어 들어서면 평지 손실을 막아야 한다.
이중 EMA를 사용하여 시장 구조를 판단하여 공백 시장 상태를 더 정확하게 판단할 수 있다.
삼키는 형태는 일방적인 힘이 갑자기 부피를 올리는 것을 보여주며, 더 큰 상황을 잡을 수 있다. 거래량과 결합하여 필터를 확대하여, 가짜 돌파구 지연을 피한다.
손해제조가 있다. 손해제도를 설정하지 않고, 시장구조 전환을 사용하여 손해를 막기 때문에, 불필요한 손해제조로 인한 슬라이드 포인트 손실을 줄일 수 있다.
이중 EMA 판단 시장 구조도 판단 오류가 발생할 수 있으며, 이로 인해 시장을 놓치거나 침입을 더 많이 한다. 적절한 EMA 주기 파라미터를 조정할 수 있다.
삼키는 형태는 흔들림에 착각하기 쉽다. 잘못된 거래를 피하기 위해 필터 조건을 추가할 수 있다.
손해배상 지점 설정이 없는 경우 더 큰 손실이 발생할 수 있다.
MACD, 에너지 파도 등과 같은 더 많은 지표와 결합하여 공백을 판단할 수 있다.
원하는 대로 어느 정도의 Stop Loss을 추가할 수 있습니다.
거래 품종 특성에 따라 EMA 주기 매개 변수를 최적화 할 수 있다.
이 전략의 전체적인 아이디어는 명확하고 이해하기 쉽으며, 지수를 사용하여 이동평균형 판단 구조를 사용하고, 포식형태를 포착한다. 판단 논리가 간단하고 거래 신호가 명확하다는 장점이 있다. 그러나 갇혀있는 위험도 있다. 추가적인 최적화를 통해 더 나은 수익을 얻을 수 있다.
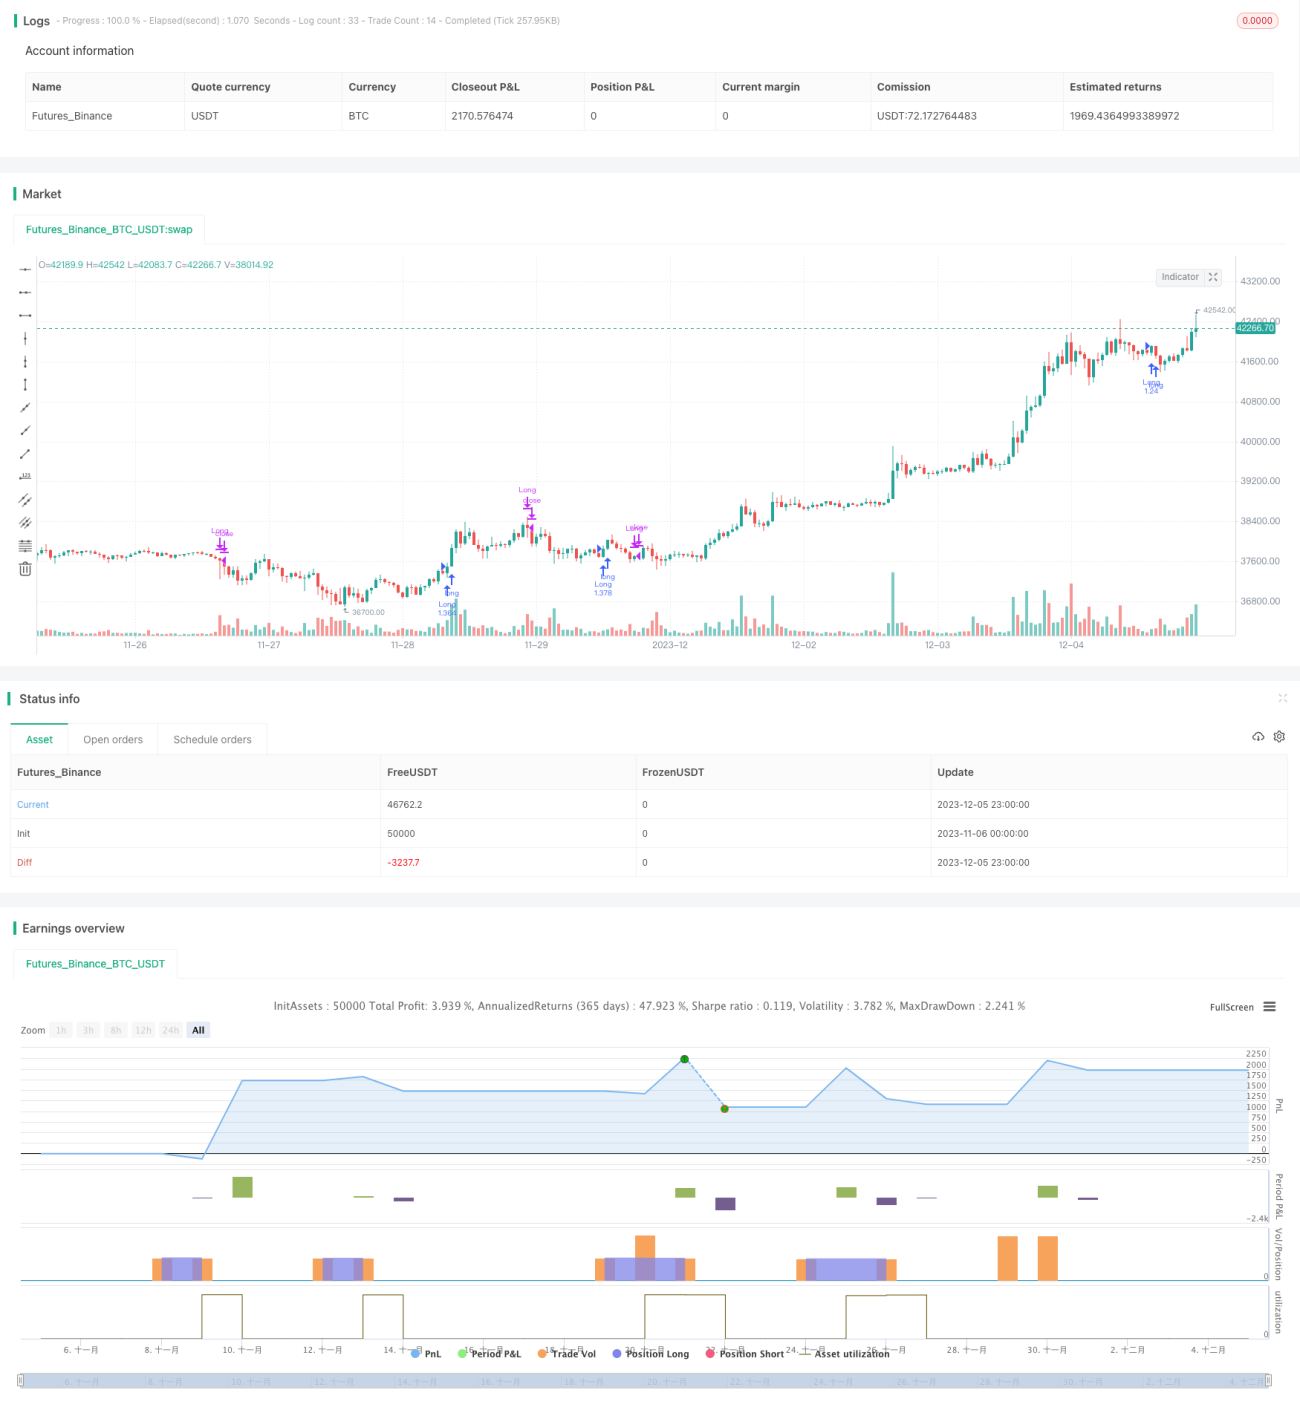
/*backtest
start: 2023-11-06 00:00:00
end: 2023-12-06 00:00:00
period: 1h
basePeriod: 15m
exchanges: [{"eid":"Futures_Binance","currency":"BTC_USDT"}]
*/
// @version=5
// # ========================================================================= #
// # | STRATEGY |
// # ========================================================================= #
strategy(
title = "fpemehd Strategy001",
shorttitle = "f_001",
overlay = true,
default_qty_type = strategy.percent_of_equity,
default_qty_value = 100,
initial_capital = 10000000,
currency = currency.USD,
slippage = 0,
commission_type = strategy.commission.cash_per_order,
commission_value = 0.01,
process_orders_on_close = true)
// # ========================================================================= #
// # | STRATEGY |
// # ========================================================================= #
// Inputs
I_start_date = input (defval = timestamp("20 Jan 1990 00:00 +0900"))
I_finish_date = input(defval = timestamp("20 Dec 2030 00:00 +0900"))
I_short_ema = input.int(defval = 15 , title = "Short EMA", minval = 1 , maxval = 300 , step = 1)
I_long_ema = input.int(defval = 30 , title = "Long EMA", minval = 1 , maxval = 300 , step = 1)
I_body = input.float(defval = 1 , title = "Size of Body", minval = 1 , maxval = 5 , step = 0.1)
time_cond = true
// Calculate Engulfing Candles
C_uptrend = false
C_downtrend = false
C_ema_short = ta.ema(source = close, length = I_short_ema)
C_ema_long = ta.ema(source = close, length = I_long_ema)
C_uptrend := close > C_ema_short and C_ema_short > C_ema_long
C_downtrend := close < C_ema_short and C_ema_short < C_ema_long
C_pre_body = math.abs(open[1]-close[1])
C_pre_body_ratio = (math.abs(open[1]-close[1])) / (math.abs(high[1]-low[1])) * 100
C_now_body = math.abs(open-close)
C_now_body_ratio = (math.abs(open-close)) / (math.abs(high-low)) * 100
C_bullish_engulfing = (open[1] > close[1] and open <= close) and (low < low[1] and high > high[1])
C_bearish_engulfing = (open[1] < close[1] and open >= close) and (low < low[1] and high > high[1])
C_avoid_doge = (C_pre_body_ratio > I_body and C_now_body_ratio > I_body) ? true : false
C_volume_filter = volume > volume[1] * 1.2
// Signals
long_signal = C_uptrend and C_bullish_engulfing and C_avoid_doge and C_volume_filter
close_signal = C_downtrend or C_bearish_engulfing
if long_signal and time_cond
strategy.entry(id = "Long", direction = strategy.long)
if close_signal and time_cond
strategy.close(id = "Long")