내일 피브 포인트 거래 전략

저자:차오장, 날짜: 2023-12-07 16:43:17
태그:

img

전반적인 설명

이것은 인도 시장에 대한 내일 거래 전략으로 전날의 오픈, 하이, 로우 및 클로즈 가격에서 계산된 주요 지원 및 저항 수준에 초점을 맞추고 있습니다. 가격은 이러한 주요 수준을 넘어서면 거래가 수행됩니다.

전략 논리

  1. 전날의 최고, 최저 및 폐쇄 가격을 계산합니다
  2. 수식을 사용하여 핵심 지원 레벨 S1, 저항 레벨 R1 및 피워트 포인트 PP를 계산합니다.
  3. 가격이 이 레벨을 넘을 때 긴 거래 또는 짧은 거래를 합니다.
  4. 스톱 로스 출구 사용

핵심 포인트 공식:

PP = (High + Low + Close) /3
R1 = 2*PP - Low
S1 = 2*PP - High 

이점 분석

  1. 주요 포인트는 높은 확률의 탈출 기회를 제공하여 더 큰 수익 잠재력을 제공합니다.
  2. 핵심 포인트를 쉽게 파악하고 명확한 거래 규칙
  3. 손해를 막기 쉽게 설정, 효과적으로 위험을 제어

위험 분석

  1. 손실을 유발하는 주요 지점에서의 가능한 거짓 파업
  2. 핵심 포인트의 유효성은 검증이 필요하지만 항상 작동하지 않을 수 있습니다.
  3. 부적절한 스톱 손실은 손실을 증가시킬 수 있습니다.

위험 완화:

  1. 다른 지표와 결합하여 거짓 브레이크를 필터링합니다.
  2. 전략 검증을 위해 긴 시간 프레임에 대한 백테스트
  3. 스톱 로스 배치 최적화

개선 할 기회

  1. 거짓 신호를 필터링하기 위해 다른 기술적 지표를 결합
  2. 각기 다른 제품에 대한 매개 변수 조정
  3. 동적 스톱 손실 조정

결론

전체적으로 이것은 역사적인 데이터로 쉽게 검증 될 수있는 간단하고 직선적인 전략입니다. 내일 전략으로, 좋은 성과를 초래하는 주요 수준에서 높은 확률의 브레이크아웃 기회를 제공합니다. 그러나 추가 최적화가 필요한 피보트 포인트에 의존하는 일부 잘못된 브레이크아웃 위험이 있습니다. 요약적으로, 이것은 구현하기 쉽고 제어 가능한 위험 내일 거래 전략입니다.


/*backtest
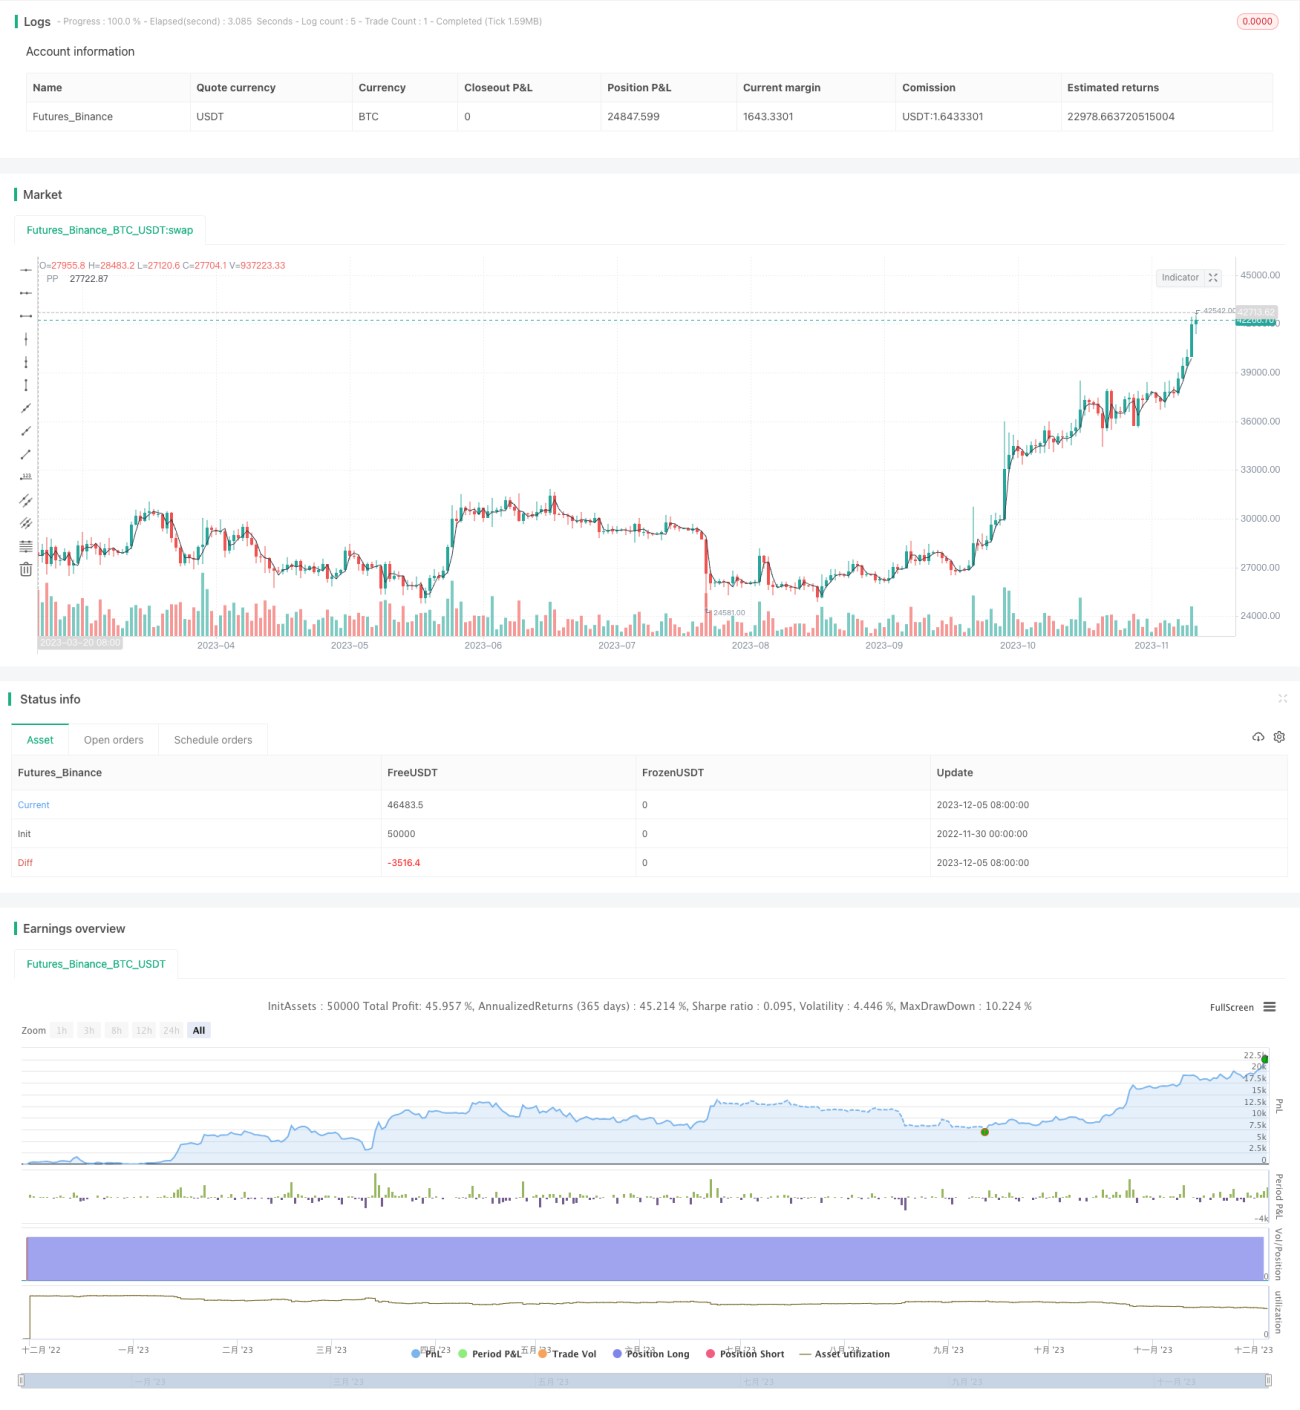
start: 2022-11-30 00:00:00
end: 2023-12-06 00:00:00
period: 1d
basePeriod: 1h
exchanges: [{"eid":"Futures_Binance","currency":"BTC_USDT"}]
*/

// This source code is subject to the terms of the Mozilla Public License 2.0 at https://mozilla.org/MPL/2.0/
// © arameshraju
//Reference credit goes to All


//@version=4
strategy("ARR-Pivote-India-Stategy",shorttitle="ARR-PP-Ind", overlay=true)

// This source code is subject to the terms of the Mozilla Public License 2.0 at https://mozilla.org/MPL/2.0/
// © arameshraju
//User Input
showPrevDayHighLow = input(false, title="Show previous day's High & Low(PDH/PDL)", type=input.bool)
showPivoteLine = input(true, title="Show Pivot Point(PP)", type=input.bool)
showPivoteR1Line = input(false, title="Show Pivot Point Resistance (R1)", type=input.bool)
showPivoteS1Line = input(false, title="Show Pivot Point Support (S1)", type=input.bool)
tradeLong = input(true, title="Trade on Long Entry", type=input.bool)
tradeShort = input(false, title="Trade on Short Entry", type=input.bool)
maxLoss = input(0.5, title="Max Loss on one Trade", type=input.float)
tradeOn=input(title="Trade base Level", type=input.string,
     options=["PP", "PDH", "PDL","R1","S1"], defval="PP")

sessSpec = input("0915-1530", title="Session time", type=input.session)

// Defaults
// Colors
cColor = color.black
rColor = color.red
sColor = color.green

// Line style & Transparency
lStyle = plot.style_line
lTransp = 35

// Get High & Low
getSeries(_e, _timeFrame) => security(syminfo.tickerid, _timeFrame, _e, lookahead=barmerge.lookahead_on) 

is_newbar(res, sess) =>
    t = time(res, sess)
    na(t[1]) and not na(t) or t[1] < t

newbar = is_newbar("375", sessSpec)
// Today's Session Start timestamp
y = year(timenow)
m = month(timenow)
d = dayofmonth(timenow)

// Start & End time for Today
start = timestamp(y, m, d, 09, 15)
end = start + 86400000


PrevDayHigh = getSeries(high[1], 'D')
PrevDayLow = getSeries(low[1], 'D')
PrevDayClose = getSeries(close[1], 'D')

PivoteLine=(PrevDayHigh+PrevDayLow+PrevDayClose) /3
PivoteR1=(PivoteLine*2) -PrevDayLow

PivoteS1=(PivoteLine*2) -PrevDayHigh

orbPrevDayOpen = getSeries(open[1], 'D')
orbPrevDayClose = getSeries(close[1], 'D')

// //Preview Day High line
// _pdh = line.new(start, PrevDayHigh, end, PrevDayHigh, xloc.bar_time, color=color.red, style=line.style_solid, width=2)
// line.delete(_pdh[1])
// _pdl = line.new(start, PrevDayLow, end, PrevDayLow, xloc.bar_time, color=color.green, style=line.style_solid, width=2)
// line.delete(_pdl[1])
// _Pp = line.new(start, PrevDayLow, end, PrevDayLow, xloc.bar_time, color=color.green, style=line.style_dashed, width=2)
// line.delete(_Pp[1])


// //Previous Day Low Line
// l_pdh = label.new(start, PrevDayHigh, text="PD", xloc=xloc.bar_time, textcolor=rColor, style=label.style_none)
// label.delete(l_pdh[1])
// l_pdl = label.new(start, PrevDayLow, text="PD", xloc=xloc.bar_time, textcolor=sColor, style=label.style_none)
// label.delete(l_pdl[1])

// //Pivote Line

// l_pp = label.new(start, PivoteLine, text="PP", xloc=xloc.bar_time, textcolor=color.black, style=label.style_none)
// label.delete(l_pp[1])
// l_R1 = label.new(start, PivoteR1, text="R1", xloc=xloc.bar_time, textcolor=color.fuchsia, style=label.style_none)
// label.delete(l_pp[1])
// l_SR = label.new(start, PivoteS1, text="S2", xloc=xloc.bar_time, textcolor=color.navy, style=label.style_none)
// label.delete(l_pp[1])


plot(showPrevDayHighLow?PrevDayHigh:na , title=' PDH', color=rColor)
plot(showPrevDayHighLow?PrevDayLow:na, title=' PDL', color=sColor)
plot(showPivoteLine?PivoteLine:na, title=' PP', color=color.black)
plot(showPivoteR1Line?PivoteR1:na, title=' R1', color=color.fuchsia)
plot(showPivoteS1Line?PivoteS1:na, title=' S1', color=color.navy)

// Today's Session Start timestamp
// Start & End time for Today
//endTime = timestamp(t, m, d, 15, 00)

tradeEventPrice= if string("PDH")==tradeOn 
    PrevDayHigh
else if string("PDL")==tradeOn
    PrevDayLow
else if string("R1")==tradeOn
    PivoteR1
else if string("S1")==tradeOn
    PivoteS1
else
    PivoteLine


//tradeEventPrice=PrevDayHigh

if (open < tradeEventPrice) and ( close >tradeEventPrice ) and ( hour < 13 ) and tradeLong
	strategy.entry("buy", strategy.long, 1, when=strategy.position_size <= 0)

if (open > tradeEventPrice) and ( close <tradeEventPrice ) and ( hour < 13 ) and  tradeShort
	strategy.entry("Sell", strategy.short, 1, when=strategy.position_size <= 0)

mxloss=orbPrevDayClose*maxLoss

strategy.exit("exit", "buy",  loss = mxloss) 
strategy.exit("exit", "Sell",  loss = mxloss) 


strategy.close_all(when =   hour == 15   , comment = "close all entries")


더 많은